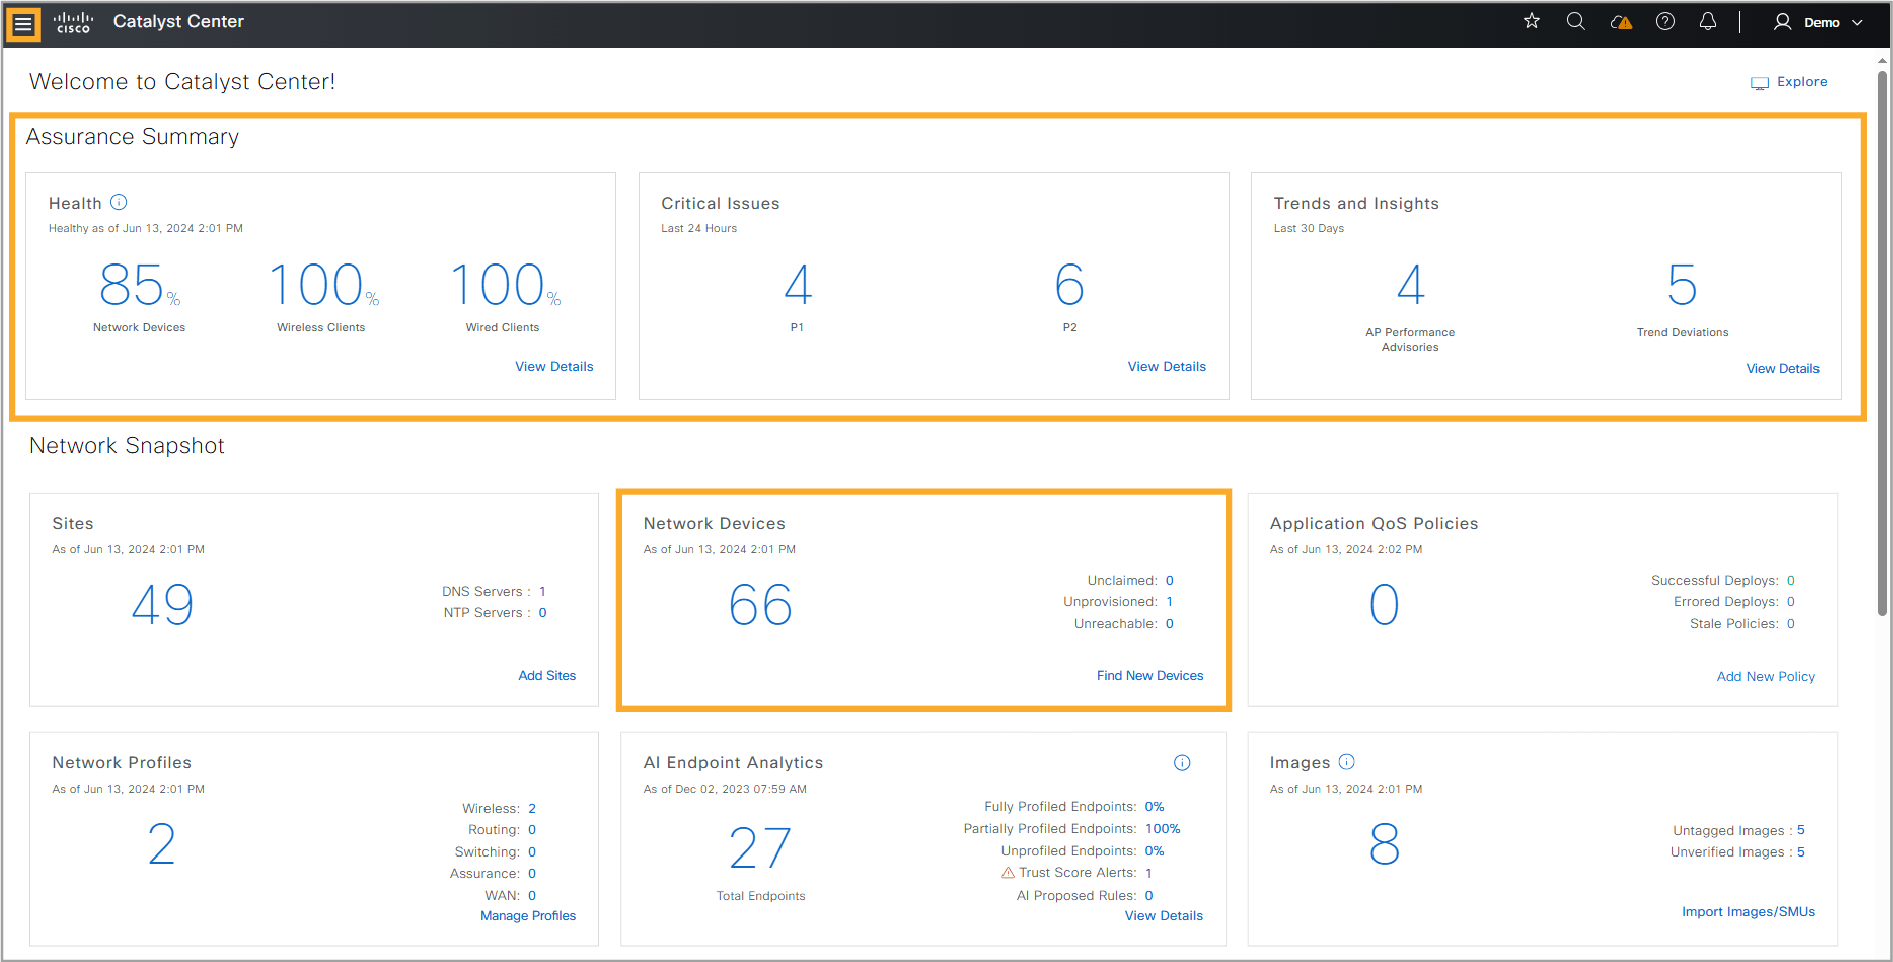
The Cisco Catalyst Center dashboard provides an overview of network health and helps identify and remedy issues. Automation and orchestration capabilities provide zero-touch provisioning based on profiles, facilitating network deployment in remote branches. Advanced assurance and analytics capabilities use deep insights from devices, streaming telemetry, and rich context to deliver an experience while proactively monitoring, troubleshooting, and optimizing your wired and wireless network.
Cisco Catalyst Center 儀表板提供網路健康狀態的總覽,協助找出並解決問題。自動化與協調能力可根據設定檔提供零接觸佈建,方便在遠端分支部署網路。進階的保證與分析能力則運用來自裝置的深入資訊、串流遙測資料與豐富情境,主動監控、疑難排解並最佳化您的有線與無線網路,藉此提供更好的體驗。
For further enhancement of network management, Cisco Catalyst Center offers a suite of powerful tools, as shown in the following figure. You should be familiar with these tools and understand how they can be used to maximize efficiency and performance in your network operations.
為進一步強化網路管理,Cisco Catalyst Center 提供一整套強大的工具,如下圖所示。您應熟悉這些工具,並瞭解如何運用它們來最大化網路營運的效率與效能。
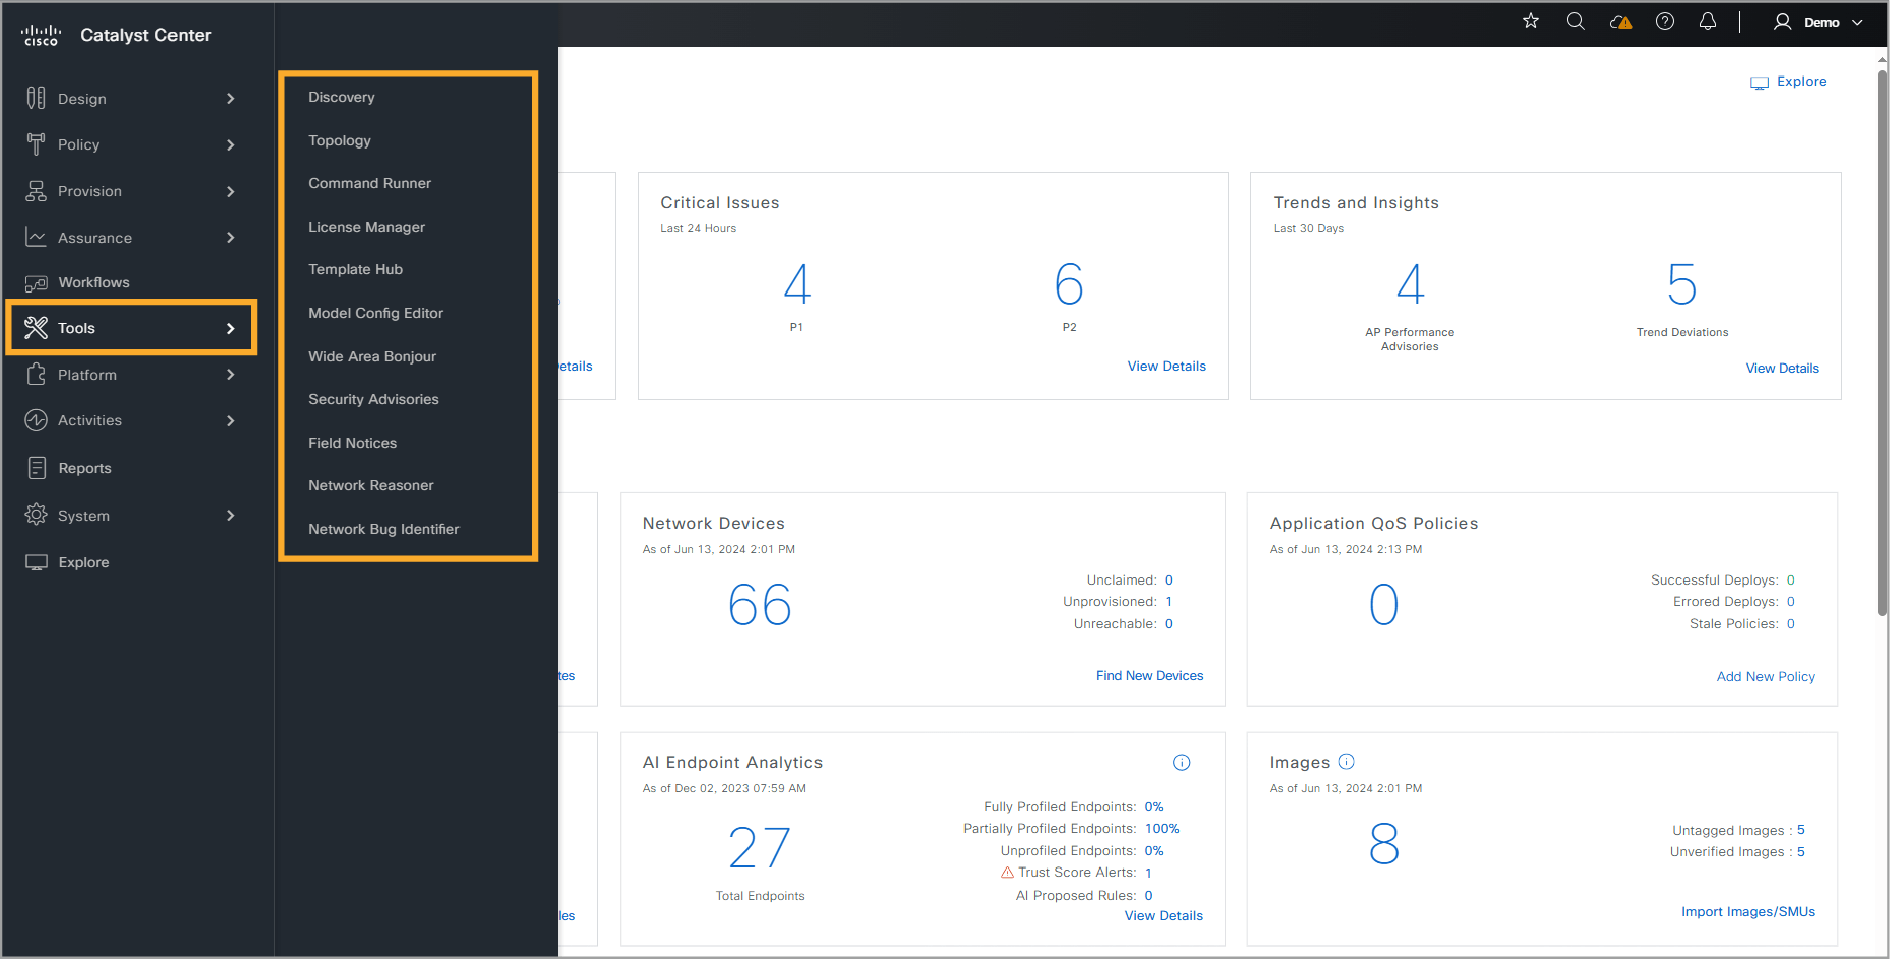
The tools within Cisco Catalyst Center include the following:
Cisco Catalyst Center 內建的工具包括:
- Discovery: The Discovery feature is designed to scan the network for connected devices. Once the devices are discovered, this feature compiles and sends the list of connected devices to the inventory, ensuring that the network inventory is always up to date and accurately reflects the current network topology.探索(Discovery):探索功能旨在掃描網路中已連線的裝置。裝置一經探索,此功能會彙整已連線裝置的清單並傳送至庫存,確保網路庫存隨時保持最新並準確反映目前的網路拓樸。
- Topology: The Topology tool provides a graphical representation of your network. Cisco Catalyst Center uses the Discovery settings that you have configured to identify the devices within your network and assigns a device role to them. These roles can be assigned during discovery or later modified in the Device Inventory. Based on the assigned roles, Cisco Catalyst Center constructs a detailed physical topology map. This map includes comprehensive device-level data, allowing for a clear and organized visualization of your network's structure and components.拓樸(Topology):拓樸工具能以圖形方式呈現您的網路。Cisco Catalyst Center 會使用您所設定的探索設定,找出網路中的裝置並指派裝置角色,這些角色可在探索時指派,也可日後於裝置庫存中修改。根據所指派的角色,Cisco Catalyst Center 會建構詳細的實體拓樸圖,其中包含完整的裝置層級資料,讓您能清楚且有條理地檢視網路的結構與元件。
- Command Runner:The Command Runner tool enables you to send diagnostic CLI commands to the selected devices within your network. It allows you to run and view the output of these commands directly from Cisco Catalyst Center. Currently, only
showand other read-only commands are permitted, ensuring that the tool is used for diagnostic purposes. While Command Runner supports only a subset of shortcuts available in a standalone terminal, it provides a convenient way to gather important diagnostic information from your network devices.指令執行器(Command Runner):指令執行器工具讓您能向網路中選定的裝置傳送診斷用的 CLI 指令,並直接從 Cisco Catalyst Center 執行並檢視這些指令的輸出。目前僅允許show及其他唯讀指令,以確保此工具僅用於診斷用途。雖然指令執行器僅支援獨立終端機中部分快速鍵,但仍能方便地從網路裝置取得重要的診斷資訊。 - License Manager: The Cisco Catalyst Center License Manager tool helps you visualize and manage all your Cisco product licenses, including Smart Account licenses. This feature provides a centralized interface to keep track of license usage, compliance, and expiration, ensuring that you have the necessary licenses for your network devices and services.授權管理員(License Manager):Cisco Catalyst Center 授權管理員工具協助您檢視並管理所有 Cisco 產品授權,包括 Smart Account 授權。此功能提供集中介面,追蹤授權使用情況、合規性與到期時間,確保您的網路裝置與服務擁有所需的授權。
- Template Hub: Cisco Catalyst Center provides an interactive template hub for authoring CLI templates. You can easily design templates with predefined configurations using parameterized elements or variables. Once a template is created, it can be deployed across multiple devices and sites within your network. This functionality allows for streamlined and consistent configuration management, ensuring that all devices adhere to the desired configuration standards and policies.範本中心(Template Hub):Cisco Catalyst Center 提供互動式範本中心,用於編寫 CLI 範本。您可使用參數化元素或變數,輕鬆設計含有預先定義設定的範本。範本建立完成後,即可部署到網路中多個裝置與站點,讓設定管理更加精簡一致,確保所有裝置都符合所需的設定標準與政策。
- Model Config Editor:Model Config allows you to define advanced customizations of the Cisco Validated Designs (CVDs).The Model Config Editor tool in Cisco Catalyst Center simplifies network provisioning—it extracts complex device configurations and enables customizable network setups through an intuitive GUI instead of traditional device-specific CLIs. This approach streamlines the configuration process, making it easier to manage and deploy consistent configurations across multiple devices without needing extensive CLI knowledge.模型設定編輯器(Model Config Editor):模型設定(Model Config)讓您能對 Cisco 驗證設計(CVD)定義進階自訂。Cisco Catalyst Center 中的模型設定編輯器工具能簡化網路佈建——它會擷取複雜的裝置設定,並透過直覺的圖形介面(而非傳統的裝置專屬 CLI)啟用可自訂的網路設定。此方式簡化了設定流程,讓您無需具備大量 CLI 知識,即可更輕鬆地在多部裝置間管理並部署一致的設定。
- Wide Area Bonjour: Cisco Catalyst Center Wide Area Bonjour is a feature that extends the capabilities of Apple's Bonjour protocol across WANs. Bonjour, also known as zero-configuration networking, is a service discovery protocol that is used by Apple devices to locate and connect to services and file-shares on a local network. Traditionally, Bonjour is limited to local network subnets, which restricts its use in larger, segmented, or geographically distributed networks. Wide Area Bonjour addresses these limitations by enabling Bonjour service discovery and advertisement across multiple subnets and geographic locations. In this way, Wide Area Bonjour expands the matrix to enterprise-grade traditional wired and wireless networks, including overlay networks such as Cisco Software-Defined Access and industry-standard BGP EVPN with VXLAN.廣域 Bonjour(Wide Area Bonjour):Cisco Catalyst Center 廣域 Bonjour 是一項將 Apple Bonjour 通訊協定的能力擴展至 WAN 的功能。Bonjour 又稱零設定網路,是 Apple 裝置用來在區域網路上尋找並連線至服務與檔案分享的服務探索協定。傳統上,Bonjour 僅限於區域網路子網路,這限制了其在較大型、經區隔或地理分散網路中的使用。廣域 Bonjour 藉由讓 Bonjour 服務探索與通告能跨越多個子網路與地理位置進行,解決了上述限制。如此一來,廣域 Bonjour 便能將此矩陣擴展至企業級的傳統有線與無線網路,包括如 Cisco 軟體定義存取(Software-Defined Access)等覆蓋網路,以及採用 VXLAN 的產業標準 BGP EVPN。
- Security Advisories: The Cisco Product Security Incident Response Team (PSIRT) plays a crucial role in handling Cisco product security incidents, overseeing the Security Vulnerability Policy, and issuing recommendations for Cisco Security Advisories and Alerts. These advisories are used by the Security Advisories tool. This tool scans the inventory of devices within Cisco Catalyst Center, identifying tools that are affected by known vulnerabilities. By employing this integration, organizations can proactively assess and mitigate security risks across their network infrastructure, ensuring the resilience and security of their digital assets.安全公告(Security Advisories):Cisco 產品安全事件應變團隊(PSIRT)在處理 Cisco 產品安全事件、監督安全弱點政策,以及發布 Cisco 安全公告與警示建議方面扮演關鍵角色。這些公告會提供給安全公告工具使用。此工具會掃描 Cisco Catalyst Center 中的裝置庫存,找出受已知弱點影響的工具。透過此整合,組織能主動評估並降低整個網路基礎設施的安全風險,確保其數位資產的韌性與安全性。
- Field Notices:Field Notices serve as notifications for significant issues directly involving Cisco products, often needing an upgrade, workaround, or other customer action. However, it is important to note that Field Notices do not address security vulnerability-related issues. By using the Field Notices tool within Cisco Catalyst Center, organizations can scan their inventory to identify devices that are affected by these known issues.現場通知(Field Notices):現場通知是針對直接涉及 Cisco 產品的重大問題所發出的通知,通常需要進行升級、採取因應措施或其他客戶端行動,但須注意現場通知並不涉及安全弱點相關問題。透過 Cisco Catalyst Center 內的現場通知工具,組織可掃描其庫存,找出受這些已知問題影響的裝置。
- Network Reasoner:The Network Reasoner tool represents a significant advancement in network management, offering automated Cisco expertise to proactively evaluate your network, or to reactively diagnose complex issues. The dashboard provides concise insights into workflows, detailing the number of affected devices in the last 24 hours and the potential impact of running a workflow on the network.網路推理引擎(Network Reasoner):網路推理引擎工具代表網路管理上的一大進展,提供自動化的 Cisco 專業知識,能主動評估您的網路,或用以被動診斷複雜問題。儀表板會提供工作流程的精簡洞察,詳細說明過去 24 小時內受影響的裝置數量,以及在網路上執行該工作流程可能造成的影響。
- Network Bug Identifier: The Cisco Catalyst Center Network Bug Identifier tool enables network administrators to scan the network for known defects or bugs that are identified by Cisco. By using this tool, administrators can identify specific patterns in device configurations or operational data and match them with known defects. The tool offers both bug-focused and device-focused views, providing comprehensive insights into potential issues that affect the network. Cisco Catalyst Center collects device configuration and operational data through CLI commands. This data is then processed in the Cisco CX Cloud to identify potential security advisories or bugs, ensuring proactive management of network vulnerabilities.網路臭蟲識別器(Network Bug Identifier):Cisco Catalyst Center 網路臭蟲識別器工具可讓網路管理員掃描網路,找出 Cisco 已識別的已知缺陷或臭蟲。透過此工具,管理員能找出裝置設定或運作資料中的特定模式,並將其與已知缺陷比對。此工具同時提供以臭蟲為主與以裝置為主的檢視方式,讓您全面掌握可能影響網路的問題。Cisco Catalyst Center 透過 CLI 指令收集裝置設定與運作資料,接著在 Cisco CX Cloud 中處理這些資料,以找出潛在的安全公告或臭蟲,確保能主動管理網路弱點。
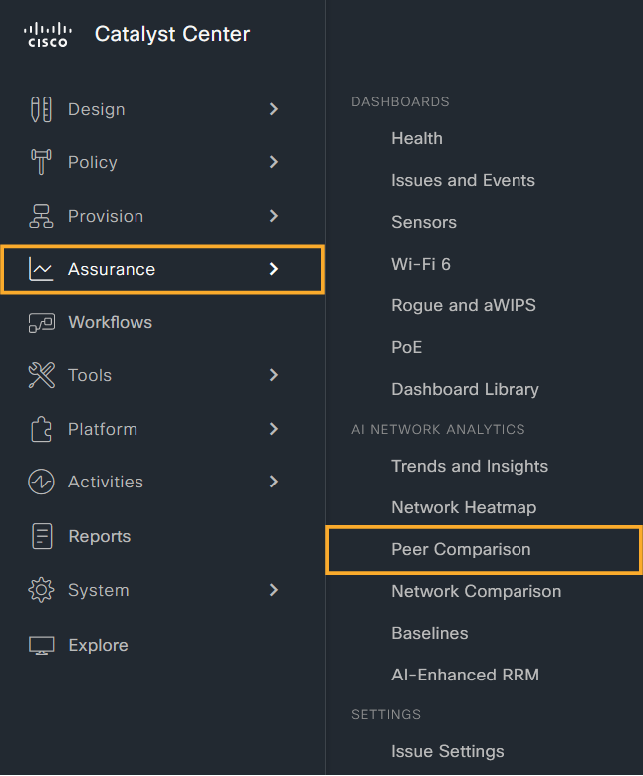
Using Cisco Catalyst Center for Performing Comparative Analytics (Peer Comparison)
使用 Cisco Catalyst Center 進行比較分析(同儕比較)
Traditional fault-detection engines often rely on simple rule-based systems that follow a straightforward "if A, then B" logic. These systems are effective for detecting known issues and straightforward scenarios but can struggle with more complex, subtle, or previously unknown problems.
傳統的故障偵測引擎通常依賴簡單的規則式系統,遵循直接的「若 A 則 B」邏輯。這類系統對於偵測已知問題與簡單情境相當有效,但對於更複雜、細微或先前未知的問題則往往力有未逮。
For instance, Cisco Catalyst Center incorporates a feature that is known as Cisco AI Network Analytics. This feature significantly enhances traditional fault-detection capabilities by using artificial intelligence (AI) and machine learning (ML) technologies. This way, it provides a more sophisticated approach to network monitoring and fault detection.
舉例而言,Cisco Catalyst Center 內建了名為 Cisco AI 網路分析(Cisco AI Network Analytics)的功能。此功能運用人工智慧(AI)與機器學習(ML)技術,大幅強化傳統的故障偵測能力,提供更精密的網路監控與故障偵測方式。
The Cisco AI Network Analytics Peer Comparison feature conducts a comprehensive assessment of the network's performance, comparing it to the performance of peer networks. Peers refer to other customers who possess wireless networks that are comparable in size and setup to one's own network. These peer networks serve as points of comparison for evaluating the performance of one's network in relation to others within a similar context. By analyzing the Key Performance Indicator (KPI) values of peer networks alongside one's own, network administrators can gain valuable insights into how their network measures up in terms of performance. They can also identify areas for improvement based on industry benchmarks and best practices. This comparative analysis helps administrators understanding the relative strengths and weaknesses of one's network and enables informed decision-making. This Cisco AI Network Analytics Peer Comparison functionality facilitates a detailed analysis of KPIs across specific days of the week or for the entire week. By comparing KPI metrics with those of peer networks, administrators can gain deeper insights into their network's performance trends and relative standings.
Cisco AI 網路分析同儕比較功能會對網路效能進行全面評估,並與同儕網路的效能相比較。「同儕」是指其他擁有規模與架構相近的無線網路的客戶。這些同儕網路可作為比較基準,用於評估自身網路在相似情境下相對於其他網路的表現。透過分析同儕網路與自身網路的關鍵績效指標(KPI)數值,網路管理員能深入瞭解自己的網路在效能上的表現,並根據產業基準與最佳實務找出可改善之處。這種比較分析有助管理員瞭解自身網路的相對優劣勢,並做出明智的決策。此 Cisco AI 網路分析同儕比較功能可針對一週中的特定日期或整週進行詳細的 KPI 分析。透過將 KPI 指標與同儕網路比較,管理員能更深入瞭解自身網路的效能趨勢與相對地位。
Peer-Comparison Window:
同儕比較視窗:
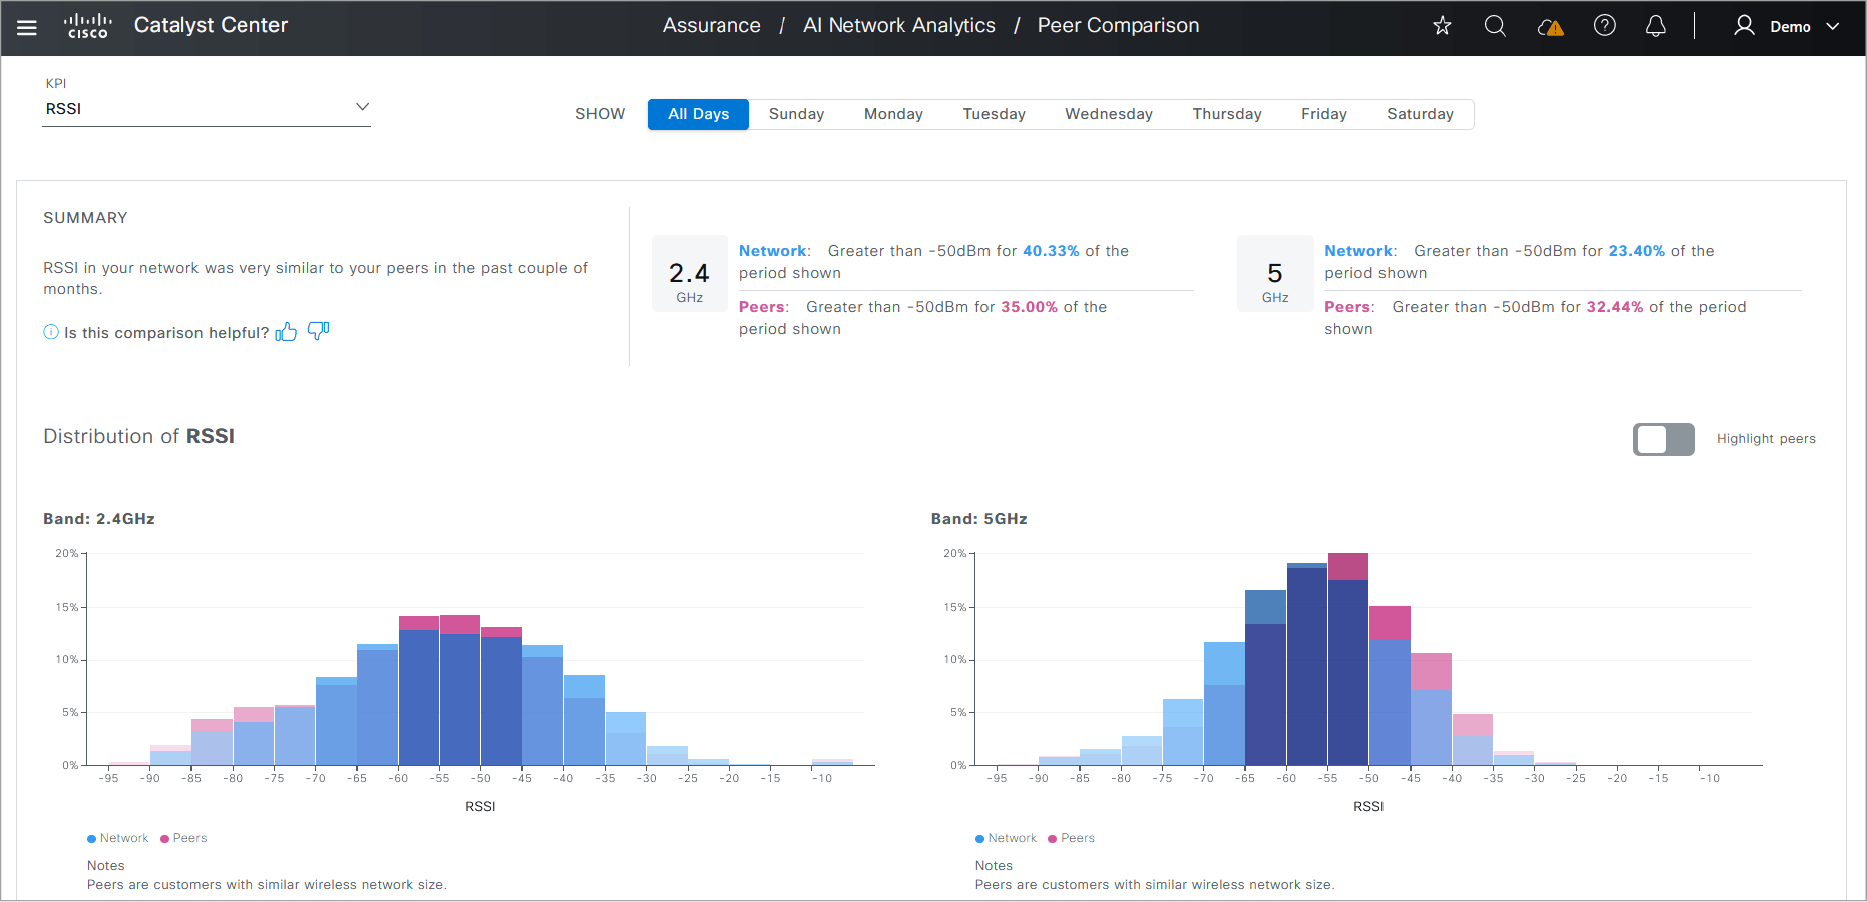
Upon opening the Peer Comparison window, users can access the following components:
開啟同儕比較(Peer Comparison)視窗後,使用者可存取下列元件:
- KPI selection: A drop-down menu enables users to choose a KPI. There are several options such as Radio Throughput, Cloud Apps Throughput, Radio Resets, Packet Failure Rate, Interference, Onboarding Error Source, Roaming Error Source, and Received Signal Strength Indicator (RSSI). The default selection is RSSI, which is used to quantify the strength of a received wireless signal and represents the power level of the signal as detected by the receiving device, such as a wireless access point (AP) or a client device. It is important for network administrators to often monitor RSSI values as part of their network management and troubleshooting efforts. This way, they can ensure optimal wireless connectivity and identify potential areas of signal degradation or coverage issues within the network. Adjustments to network infrastructure, such as repositioning access points or optimizing antenna configurations, may be made based on RSSI measurements to improve overall network performance and reliability.KPI 選擇:下拉式選單讓使用者能選擇 KPI,選項包括無線電吞吐量、雲端應用程式吞吐量、無線電重設次數、封包失敗率、干擾、上線錯誤來源、漫遊錯誤來源,以及接收信號強度指示器(RSSI)。預設選項為 RSSI,用於量化接收到的無線信號強度,代表接收裝置(例如無線基地台〔AP〕或用戶端裝置)所偵測到的信號功率等級。網路管理員在網路管理與疑難排解工作中,經常需要監控 RSSI 數值,藉此確保最佳的無線連線品質,並找出可能出現信號劣化或涵蓋範圍問題的區域。管理員可根據 RSSI 量測結果,調整網路基礎設施,例如重新放置無線基地台或最佳化天線設定,以提升整體網路效能與可靠性。
- Show: Users can specify the time interval for comparing KPI values between their network and peer networks. The default setting is All Days, which provides a comprehensive analysis across the week.顯示:使用者可指定用於比較自身網路與同儕網路 KPI 數值的時間區間。預設設定為所有天數,可提供整週的全面分析。
- Summary section: AI Network Analytics analyzes bar graphs and offers a summary of the findings for both the 2.4 GHz and 5 GHz band frequencies.摘要區段:AI 網路分析會分析長條圖,並針對 2.4 GHz 與 5 GHz 頻帶提供結果摘要。
- Peer Comparison bar graph: This graph initially showcases KPI values for the user's network in the 2.4 GHz and 5 GHz band. Clicking the Highlight Peers button shifts the focus to display KPI values for peer networks. For the following scenario in the graph, the blue color denotes the user's network, while the pink color indicates peer networks.同儕比較長條圖:此圖表最初會顯示使用者網路在 2.4 GHz 與 5 GHz 頻帶的 KPI 數值。按一下醒目提示同儕(Highlight Peers)按鈕後,畫面焦點會切換為顯示同儕網路的 KPI 數值。在下方情境圖表中,藍色代表使用者的網路,粉紅色則代表同儕網路。