Introduction
簡介
After completing this activity, you will know how to log in to the Cisco Catalyst 9800 WLC web GUI interface and how to use the GUI to monitor the WLC.
完成本活動後,你將了解如何登入 Cisco Catalyst 9800 WLC 的網頁圖形介面(GUI),以及如何使用該圖形介面監控 WLC。
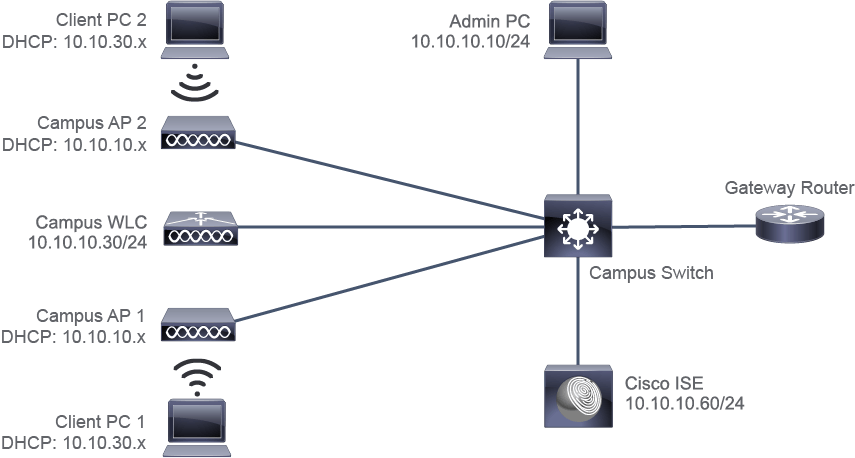
Topology
拓樸
Job Aid
工作輔助資料
Device Information
裝置資訊
Device 裝置 | Username/Password 使用者名稱/密碼 | Management IP Address 管理 IP 位址 | Employee Network (VLAN 30, WLAN employee) IP Addresses 員工網路(VLAN 30、WLAN employee)IP 位址 |
Admin PC 管理員 PC | 10.10.10.10/24 10.10.10.10/24 | ||
Client PC 1 用戶端 PC 1 | DHCP: 10.10.30.x/24 DHCP:10.10.30.x/24 | ||
Client PC 2 用戶端 PC 2 | DHCP: 10.10.30.x/24 DHCP:10.10.30.x/24 | ||
Campus WLC Campus WLC | admin/1234QWer admin/1234QWer | 10.10.10.30/24 10.10.10.30/24 | 10.10.30.30/24 10.10.30.30/24 |
Campus AP 1 Campus AP 1 | DHCP: 10.10.10.x/24 DHCP:10.10.10.x/24 | ||
Campus AP 2 Campus AP 2 | DHCP: 10.10.10.x/24 DHCP:10.10.10.x/24 | ||
Cisco ISE Cisco ISE | 10.10.10.60/24 10.10.10.60/24 | ||
Gateway Router Gateway Router | 10.10.10.1/24 10.10.10.1/24 | 10.10.30.1/24 10.10.30.1/24 |
Task 1: Log in to the WLC
任務 1:登入 WLC
There are two methods for configuring the Cisco Catalyst 9800 WLC, either from the GUI or from the CLI through its console connection. Both are effective, and in some special cases, you may need to use both configuration methods to perform different configuration steps. In this activity, you will only need the GUI.
設定 Cisco Catalyst 9800 WLC 有兩種方法,可透過圖形介面(GUI),也可透過主控台連線使用命令列介面(CLI)。兩種方式都有效,在某些特殊情況下,你可能需要同時使用這兩種設定方法來執行不同的設定步驟。在本活動中,你只需要使用圖形介面。
You will log in to the web GUI of the Cisco Catalyst 9800 WLC. This virtual WLC is available for private cloud deployments, such as VMware ESXi, KVM, and the Cisco Enterprise Network Compute System (ENCS), and for public cloud deployments on Amazon Web Services (AWS). Then you will explore the default landing page of the web GUI. Other versions of Cisco WLCs exist that have slightly different GUIs, but the core functionality remains the same.
你將登入 Cisco Catalyst 9800 WLC 的網頁圖形介面。這款虛擬 WLC 可用於私有雲部署,例如 VMware ESXi、KVM,以及 Cisco 企業網路運算系統(ENCS),也可用於 Amazon Web Services(AWS)等公有雲部署。接著你將探索網頁圖形介面的預設首頁。其他版本的 Cisco WLC 圖形介面雖略有不同,但核心功能相同。
Activity
活動
Click the Play icon in the middle of the screen or the Play button on the player below the simulation screen to begin the simulation.
點按畫面中央的播放圖示,或模擬畫面下方播放器上的播放按鈕,開始進行模擬。
You already have the Chrome browser opened on the Admin PC. Using the HTTPS protocol, connect to the web GUI of the Campus WLC by browsing to its IP address, which is provided in the Job Aid.
管理員 PC 上已開啟 Chrome 瀏覽器。使用 HTTPS 通訊協定,瀏覽至工作輔助資料中提供的 IP 位址,連線至 Campus WLC 的網頁圖形介面。
In the address bar of the browser, enter https://10.10.10.30 and press Enteror Return.
在瀏覽器的網址列中輸入 https://10.10.10.30,然後按下 Enter 或 Return 鍵。

By default, your browser does not trust the certificate that the Campus WLC presents. Despite this reported security issue, proceed to the Campus WLC web GUI by allowing the unsafe connection.
根據預設,你的瀏覽器不信任 Campus WLC 所提供的憑證。儘管有此安全性警示,仍請允許不安全的連線以繼續前往 Campus WLC 網頁圖形介面。
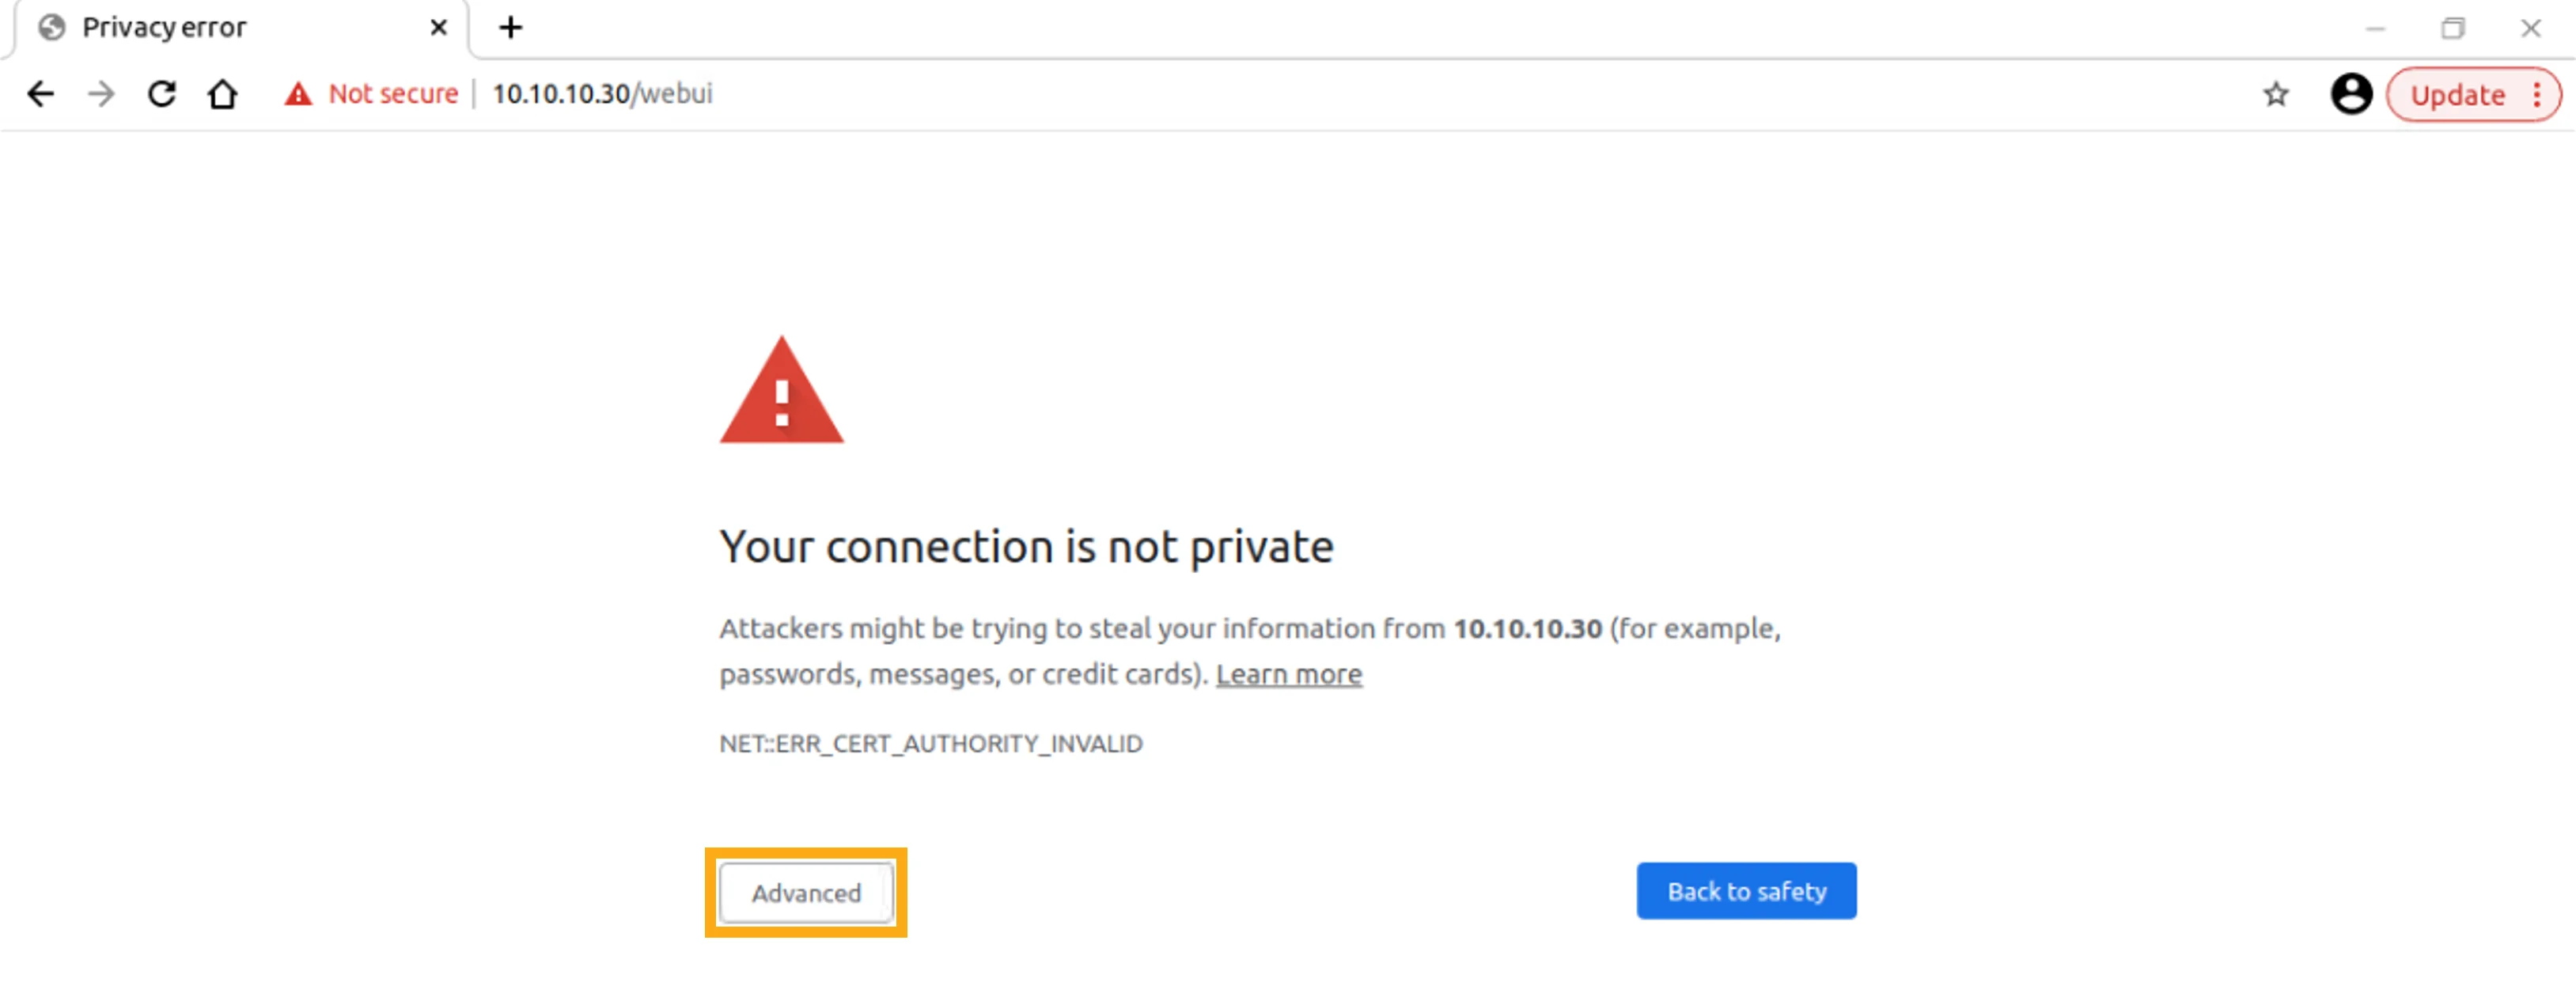
Click Advanced at the warning indicating that the Certificate Authority of the presented certificate is invalid.
在顯示所呈現憑證的憑證授權單位無效的警示中,點按進階。
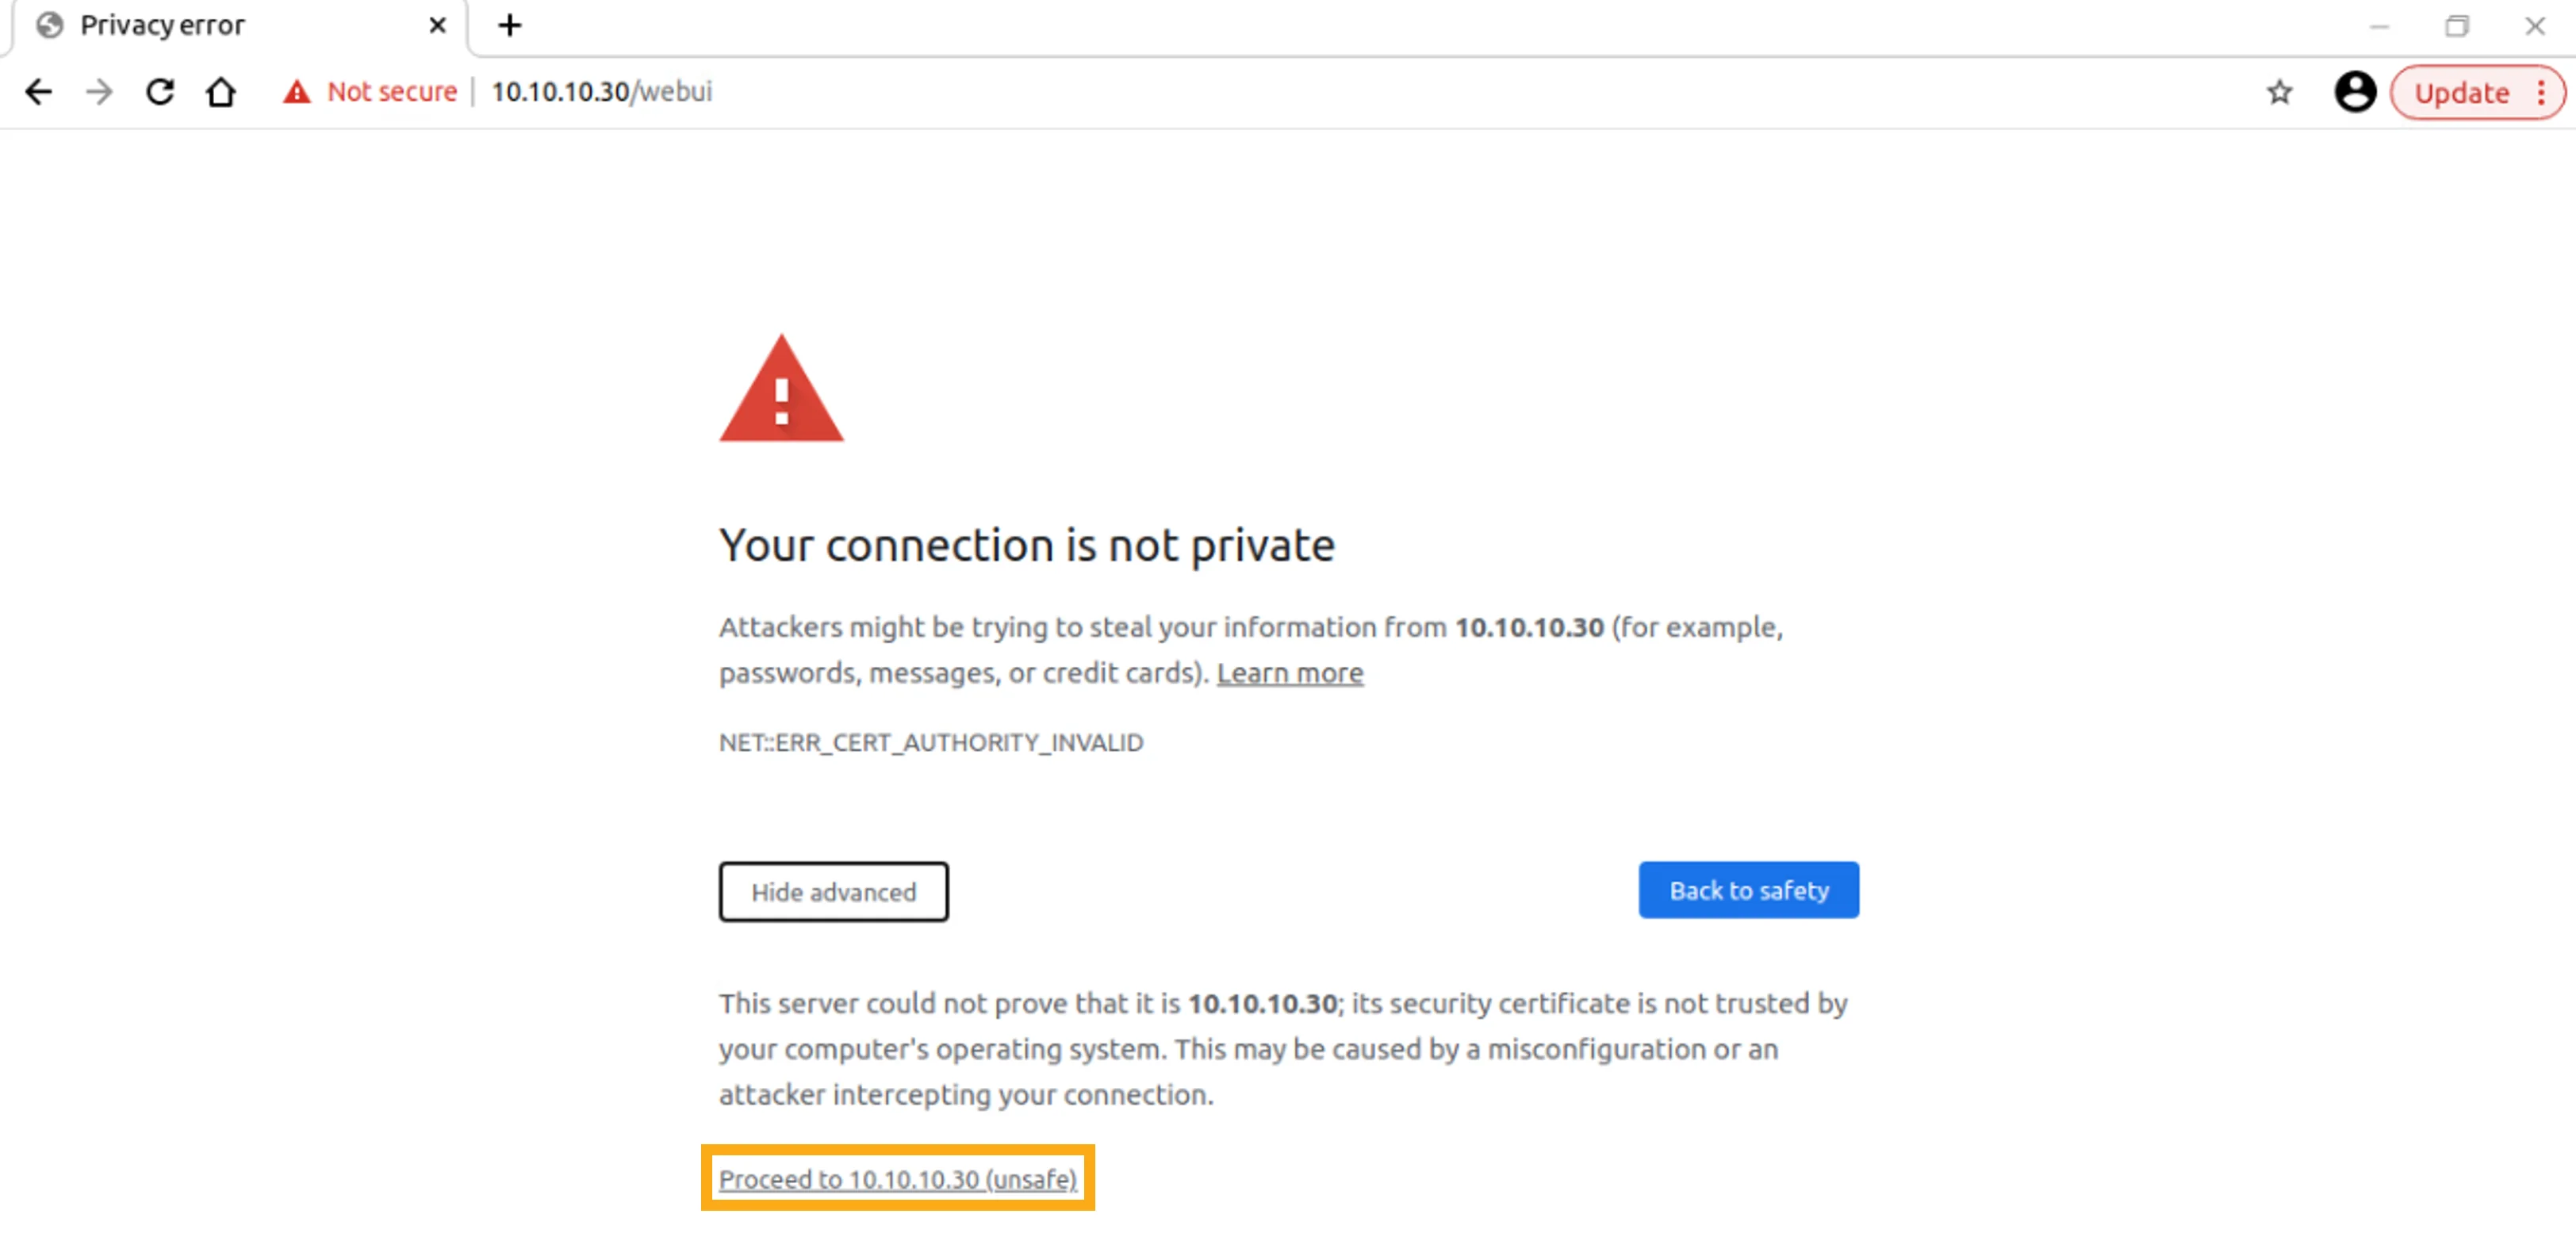
The page presents additional information indicating that the presented certificate is not trusted. Click Proceed to 10.10.10.30 (unsafe) to connect to the Campus WLC anyway.
頁面會顯示其他資訊,說明所呈現的憑證不受信任。點按前往 10.10.10.30(不安全)以仍然連線至 Campus WLC。
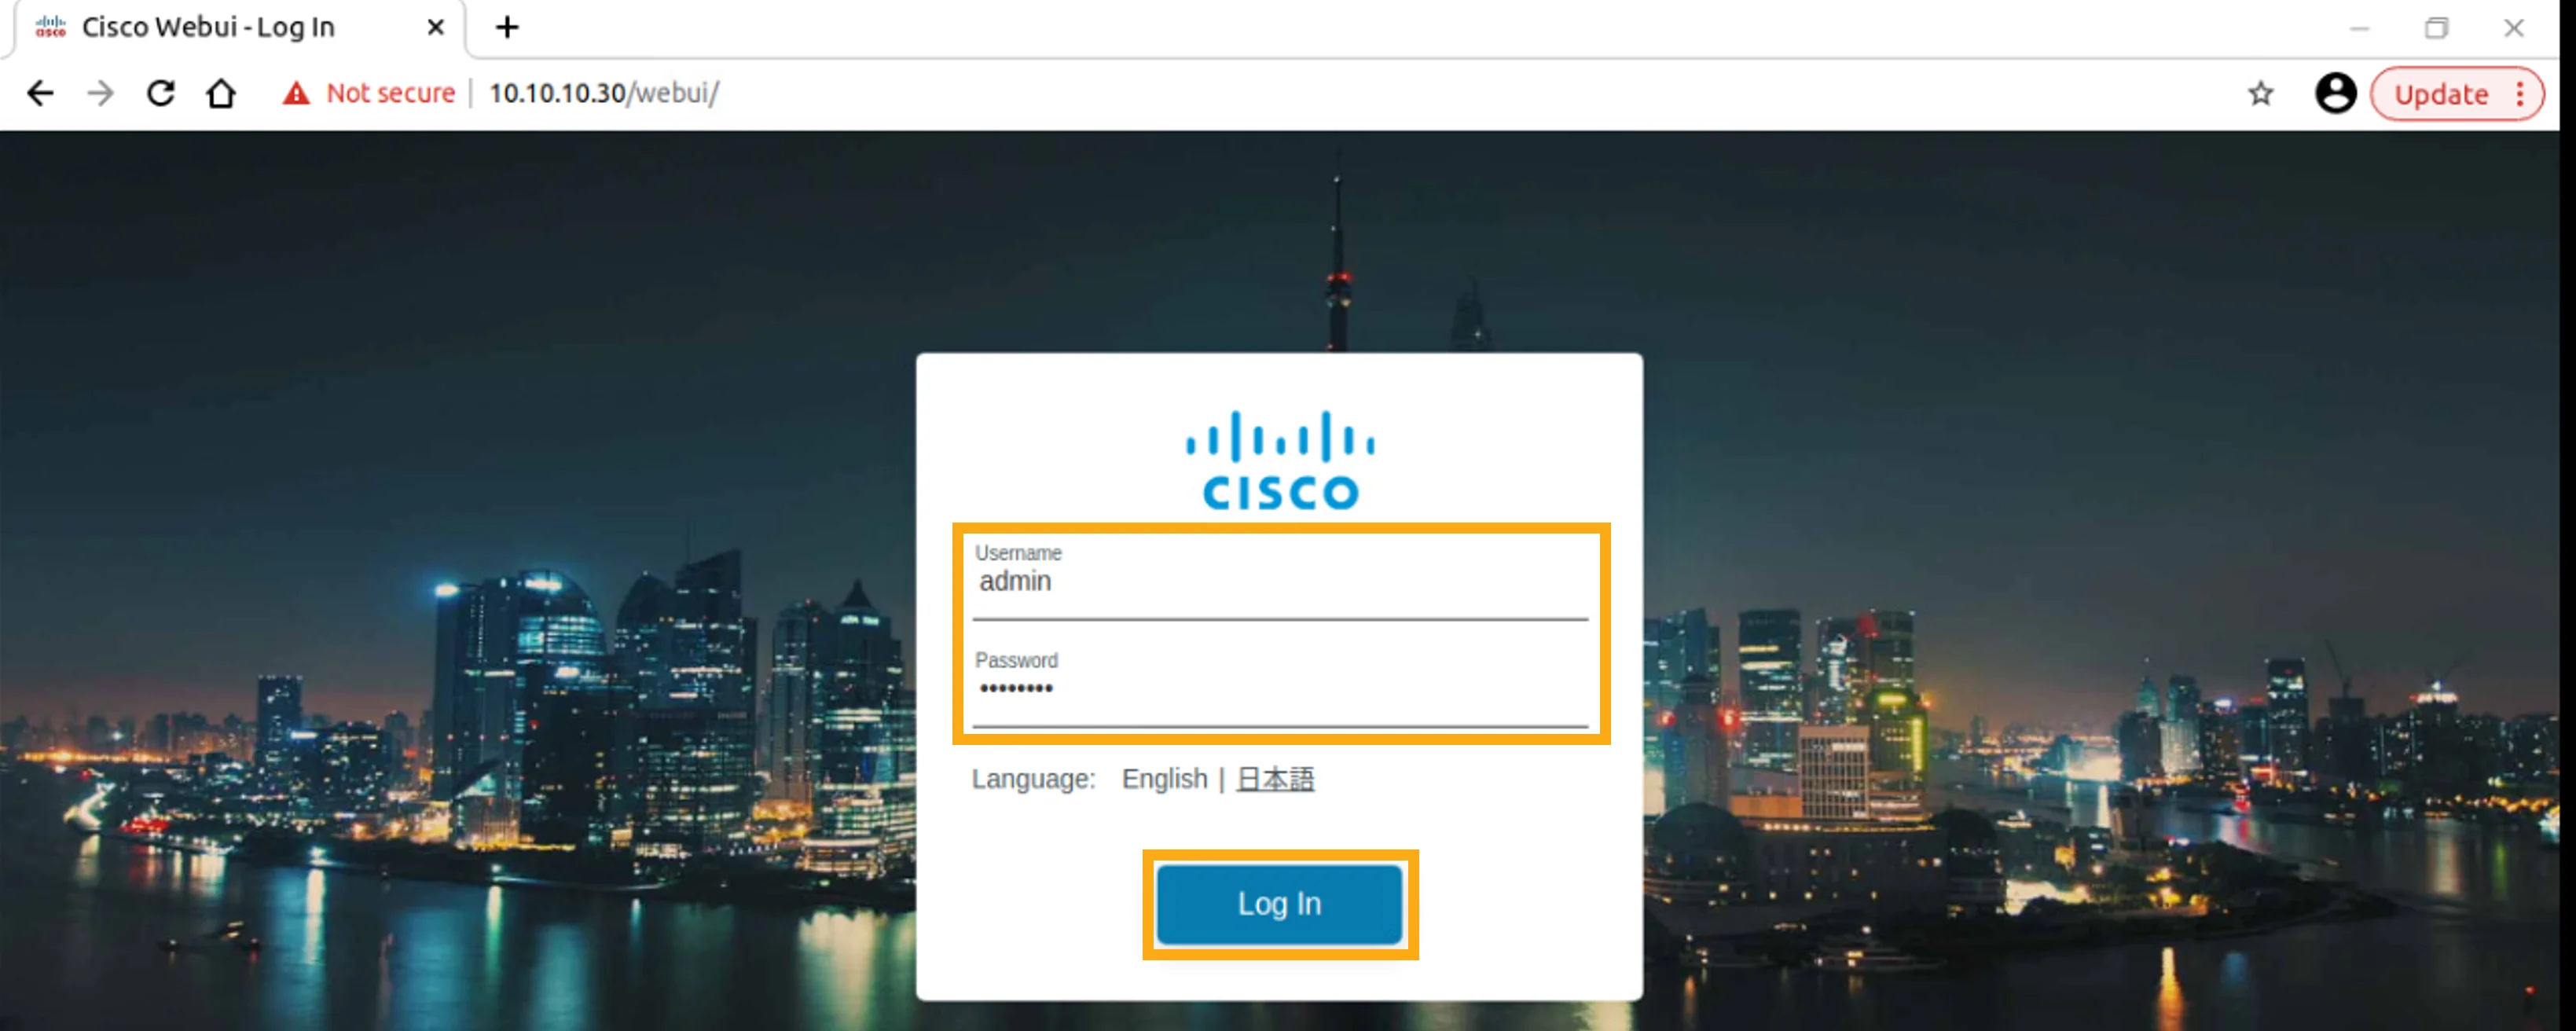
At the login page of the Campus WLC web GUI, log in with the credentials that are provided in the Job Aid.
在 Campus WLC 網頁圖形介面的登入頁面,使用工作輔助資料中提供的憑證登入。
Use these credentials to log in to the Campus WLC.
使用下列憑證登入 Campus WLC。
- Username: admin使用者名稱:admin
- Password: 1234QWer密碼:1234QWer
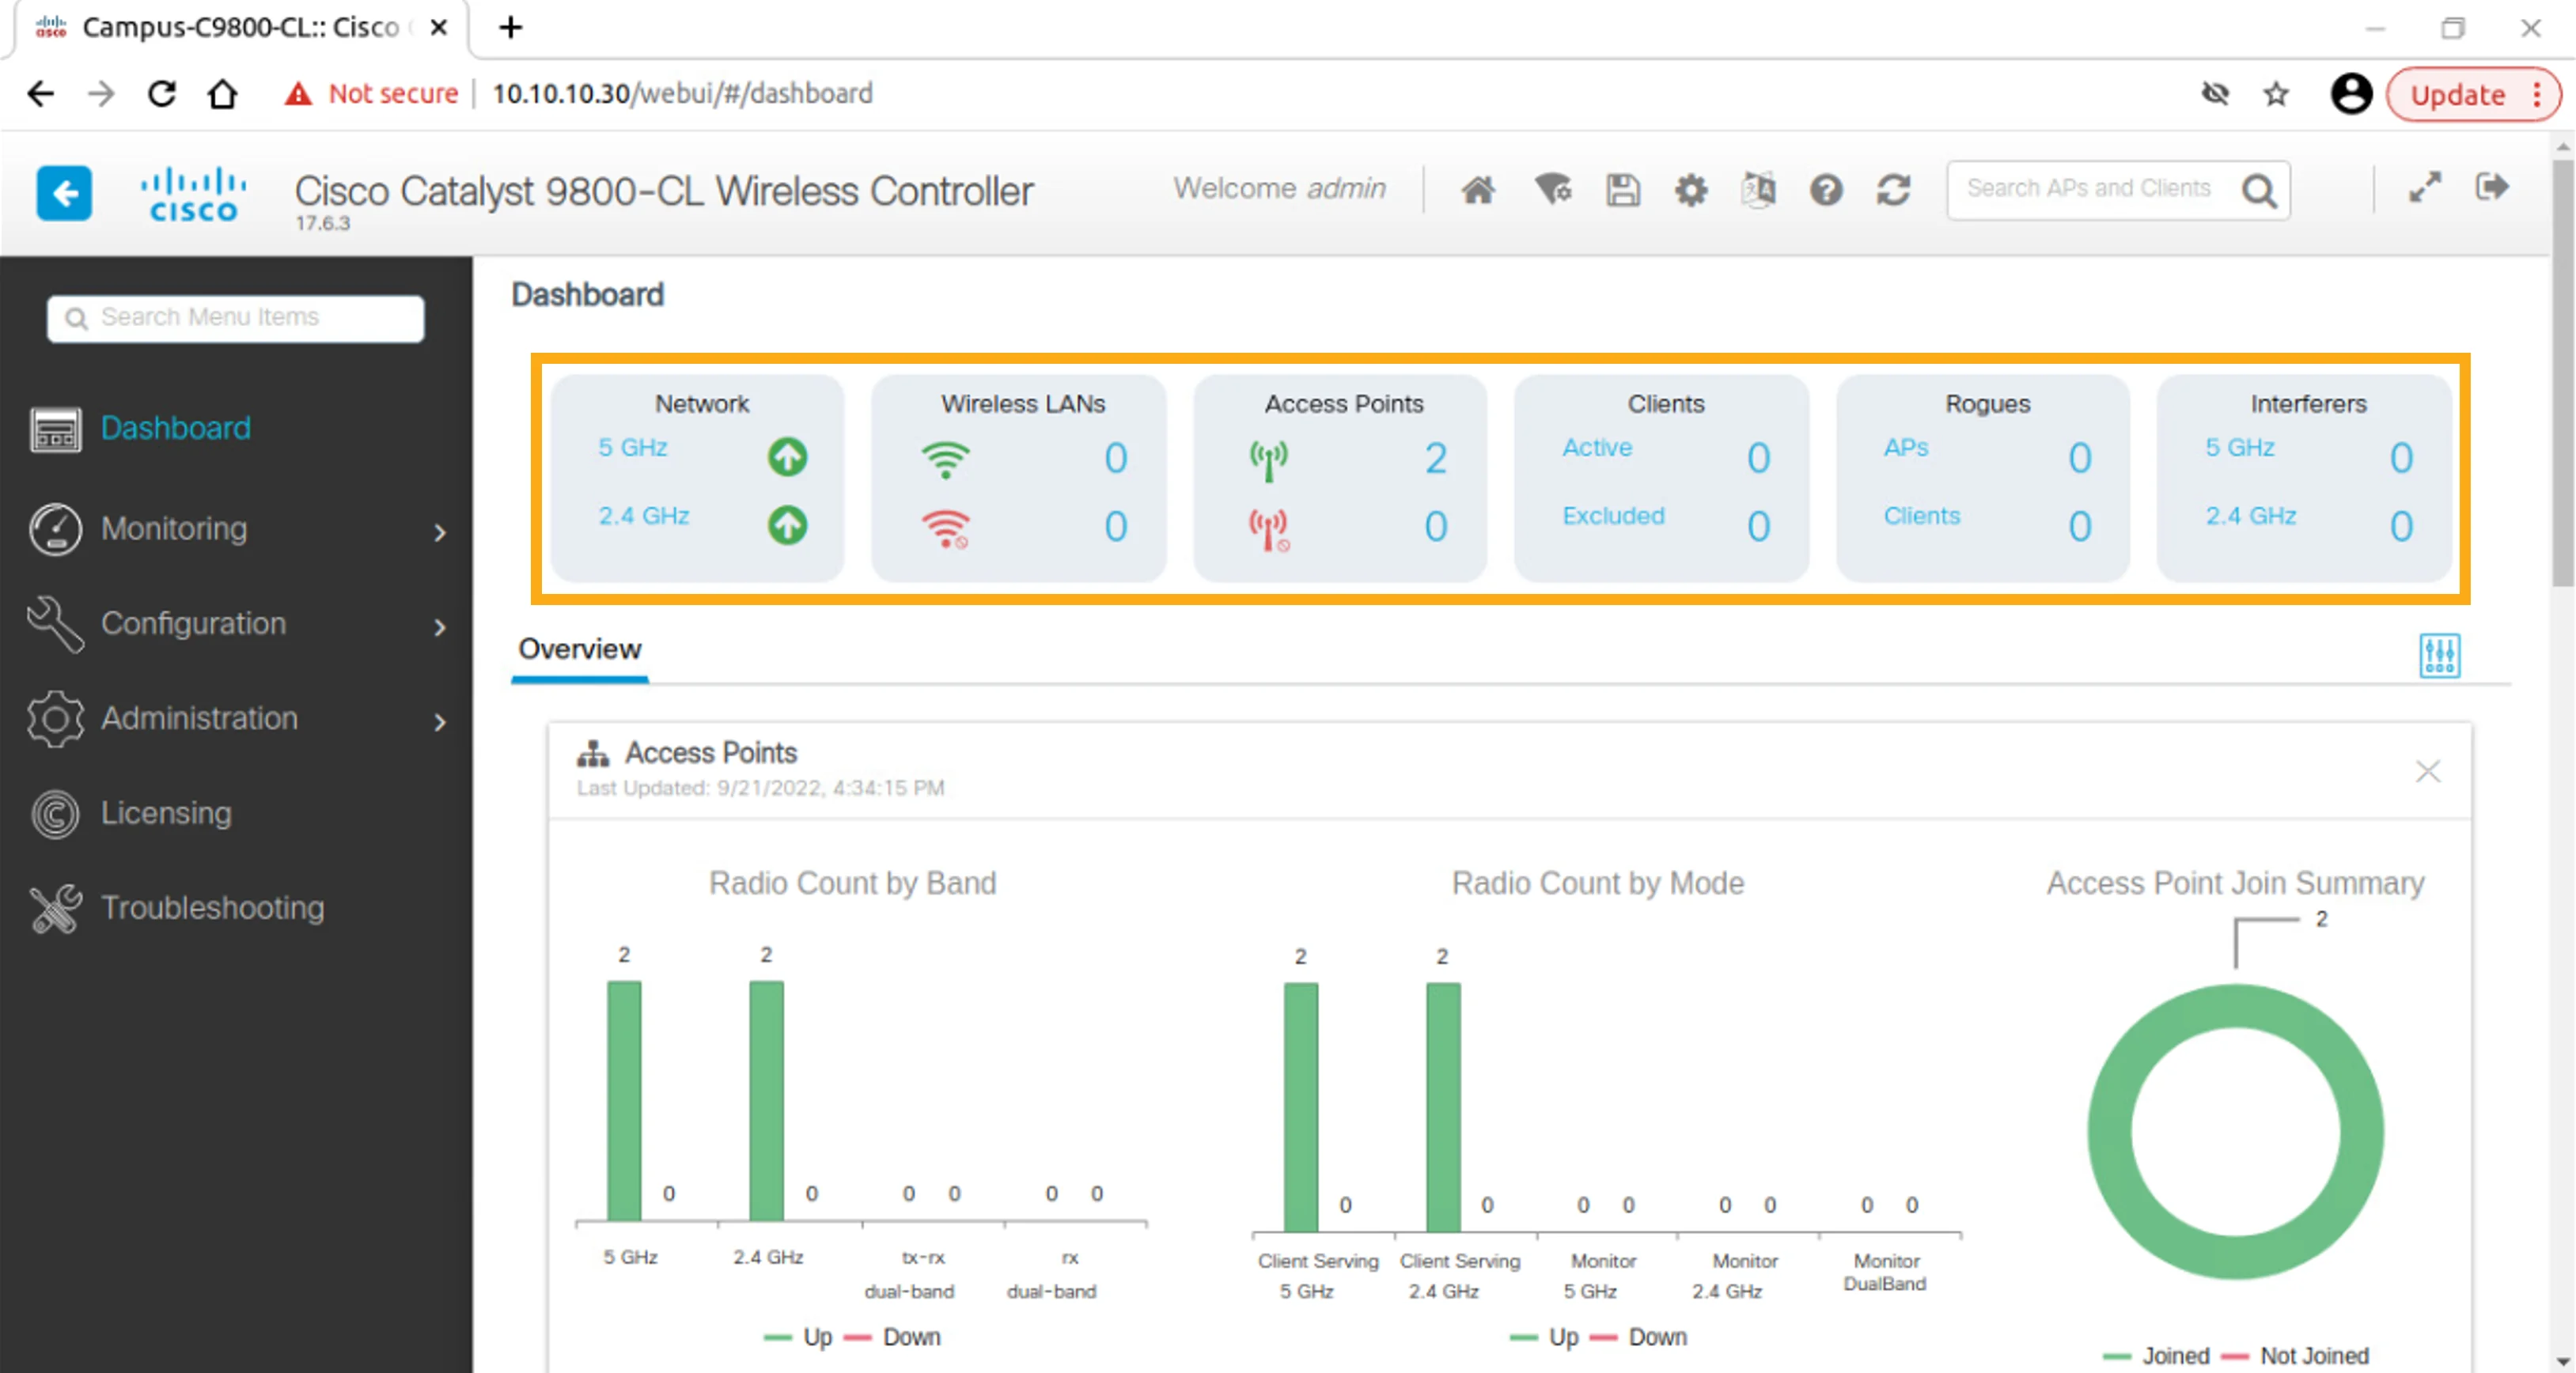
After you successfully log in, the opening screen of the Campus WLC web GUI—the dashboard—appears. It provides summarized information in several dashlets. You don’t have the ability to make configuration changes from this screen; you can only look at what the WLC is reporting. You can, however, customize the dashboard by enabling and disabling dashlets and you can change the position of the enabled dashlets on the screen.
成功登入後,Campus WLC 網頁圖形介面的首頁畫面,也就是儀表板,會隨即出現。它在數個小工具(dashlet)中提供彙總資訊。你無法在此畫面中進行設定變更,只能檢視 WLC 所回報的資訊。不過,你可以透過啟用與停用小工具來自訂儀表板,也可以變更已啟用小工具在畫面上的位置。
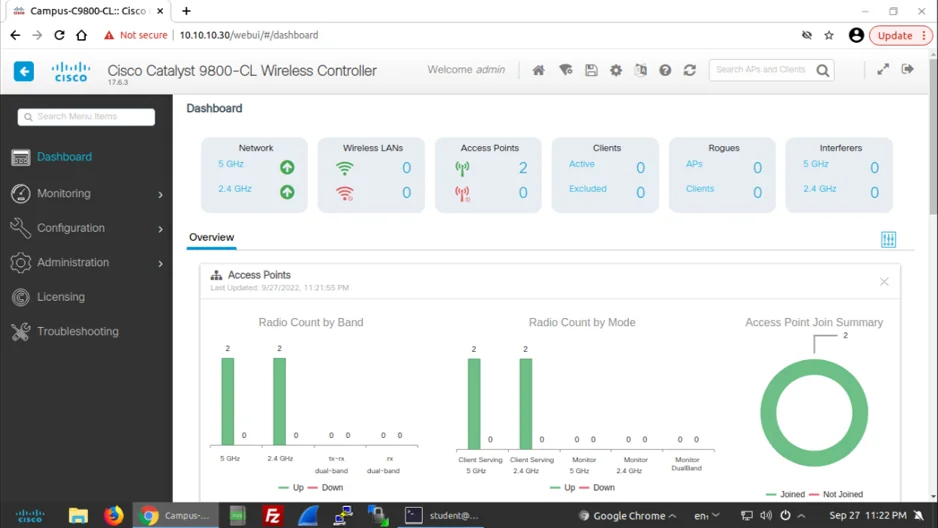
At the top of the page, observe the summarized status information. It shows the status of the 5- and 2.4-GHz networks, the number of active and inactive WLANs, the number of active and inactive access points, and counters for detected rogues and interferers.
在頁面頂端,觀察彙總的狀態資訊。其中顯示 5 GHz 與 2.4 GHz 網路的狀態、作用中與非作用中 WLAN 的數量、作用中與非作用中無線基地台(AP)的數量,以及偵測到的惡意裝置(rogue)與干擾源的計數。
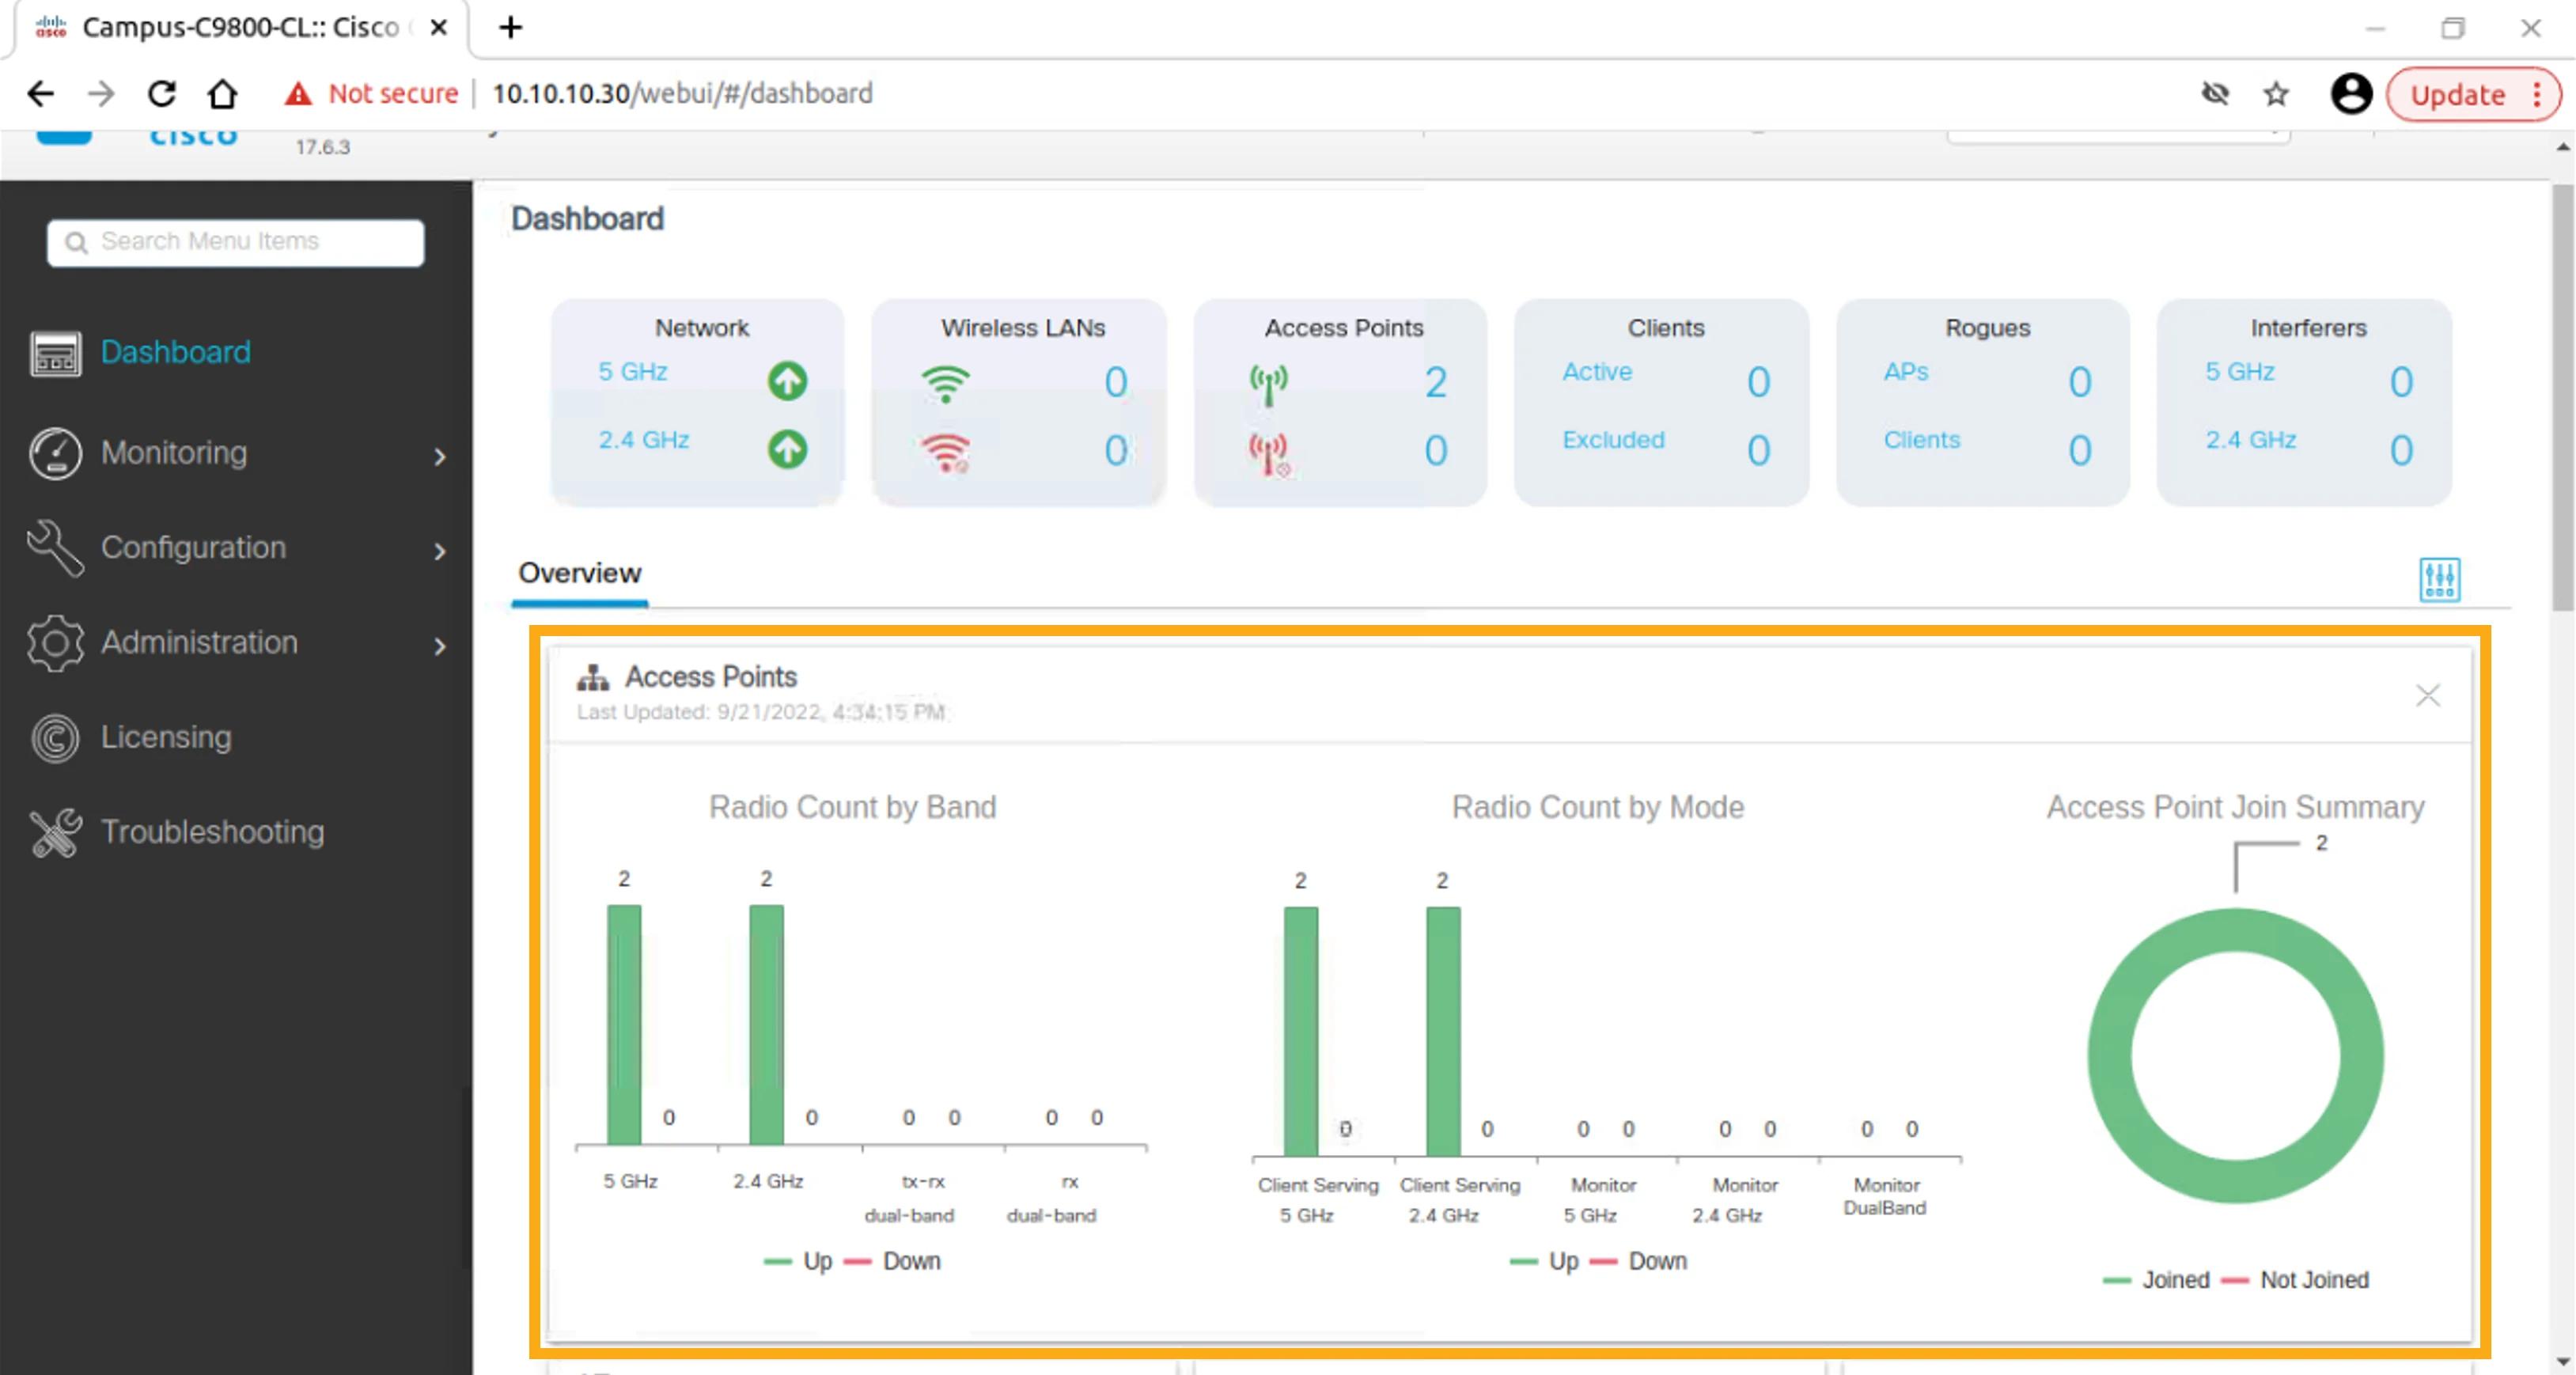
On the Dashboard GUI page, click in the scroll bar to the right to move down the page so you can see the entire Access Points dashlet and examine the provided AP information: Radio Count By Band, Radio Count by Mode, and counters showing joined and not joined APs.
在儀表板圖形介面頁面上,點按右側的捲軸區域向下移動頁面,以便完整檢視 Access Points 小工具,並檢視所提供的 AP 資訊:Radio Count By Band、Radio Count by Mode,以及已加入與未加入的 AP 計數。
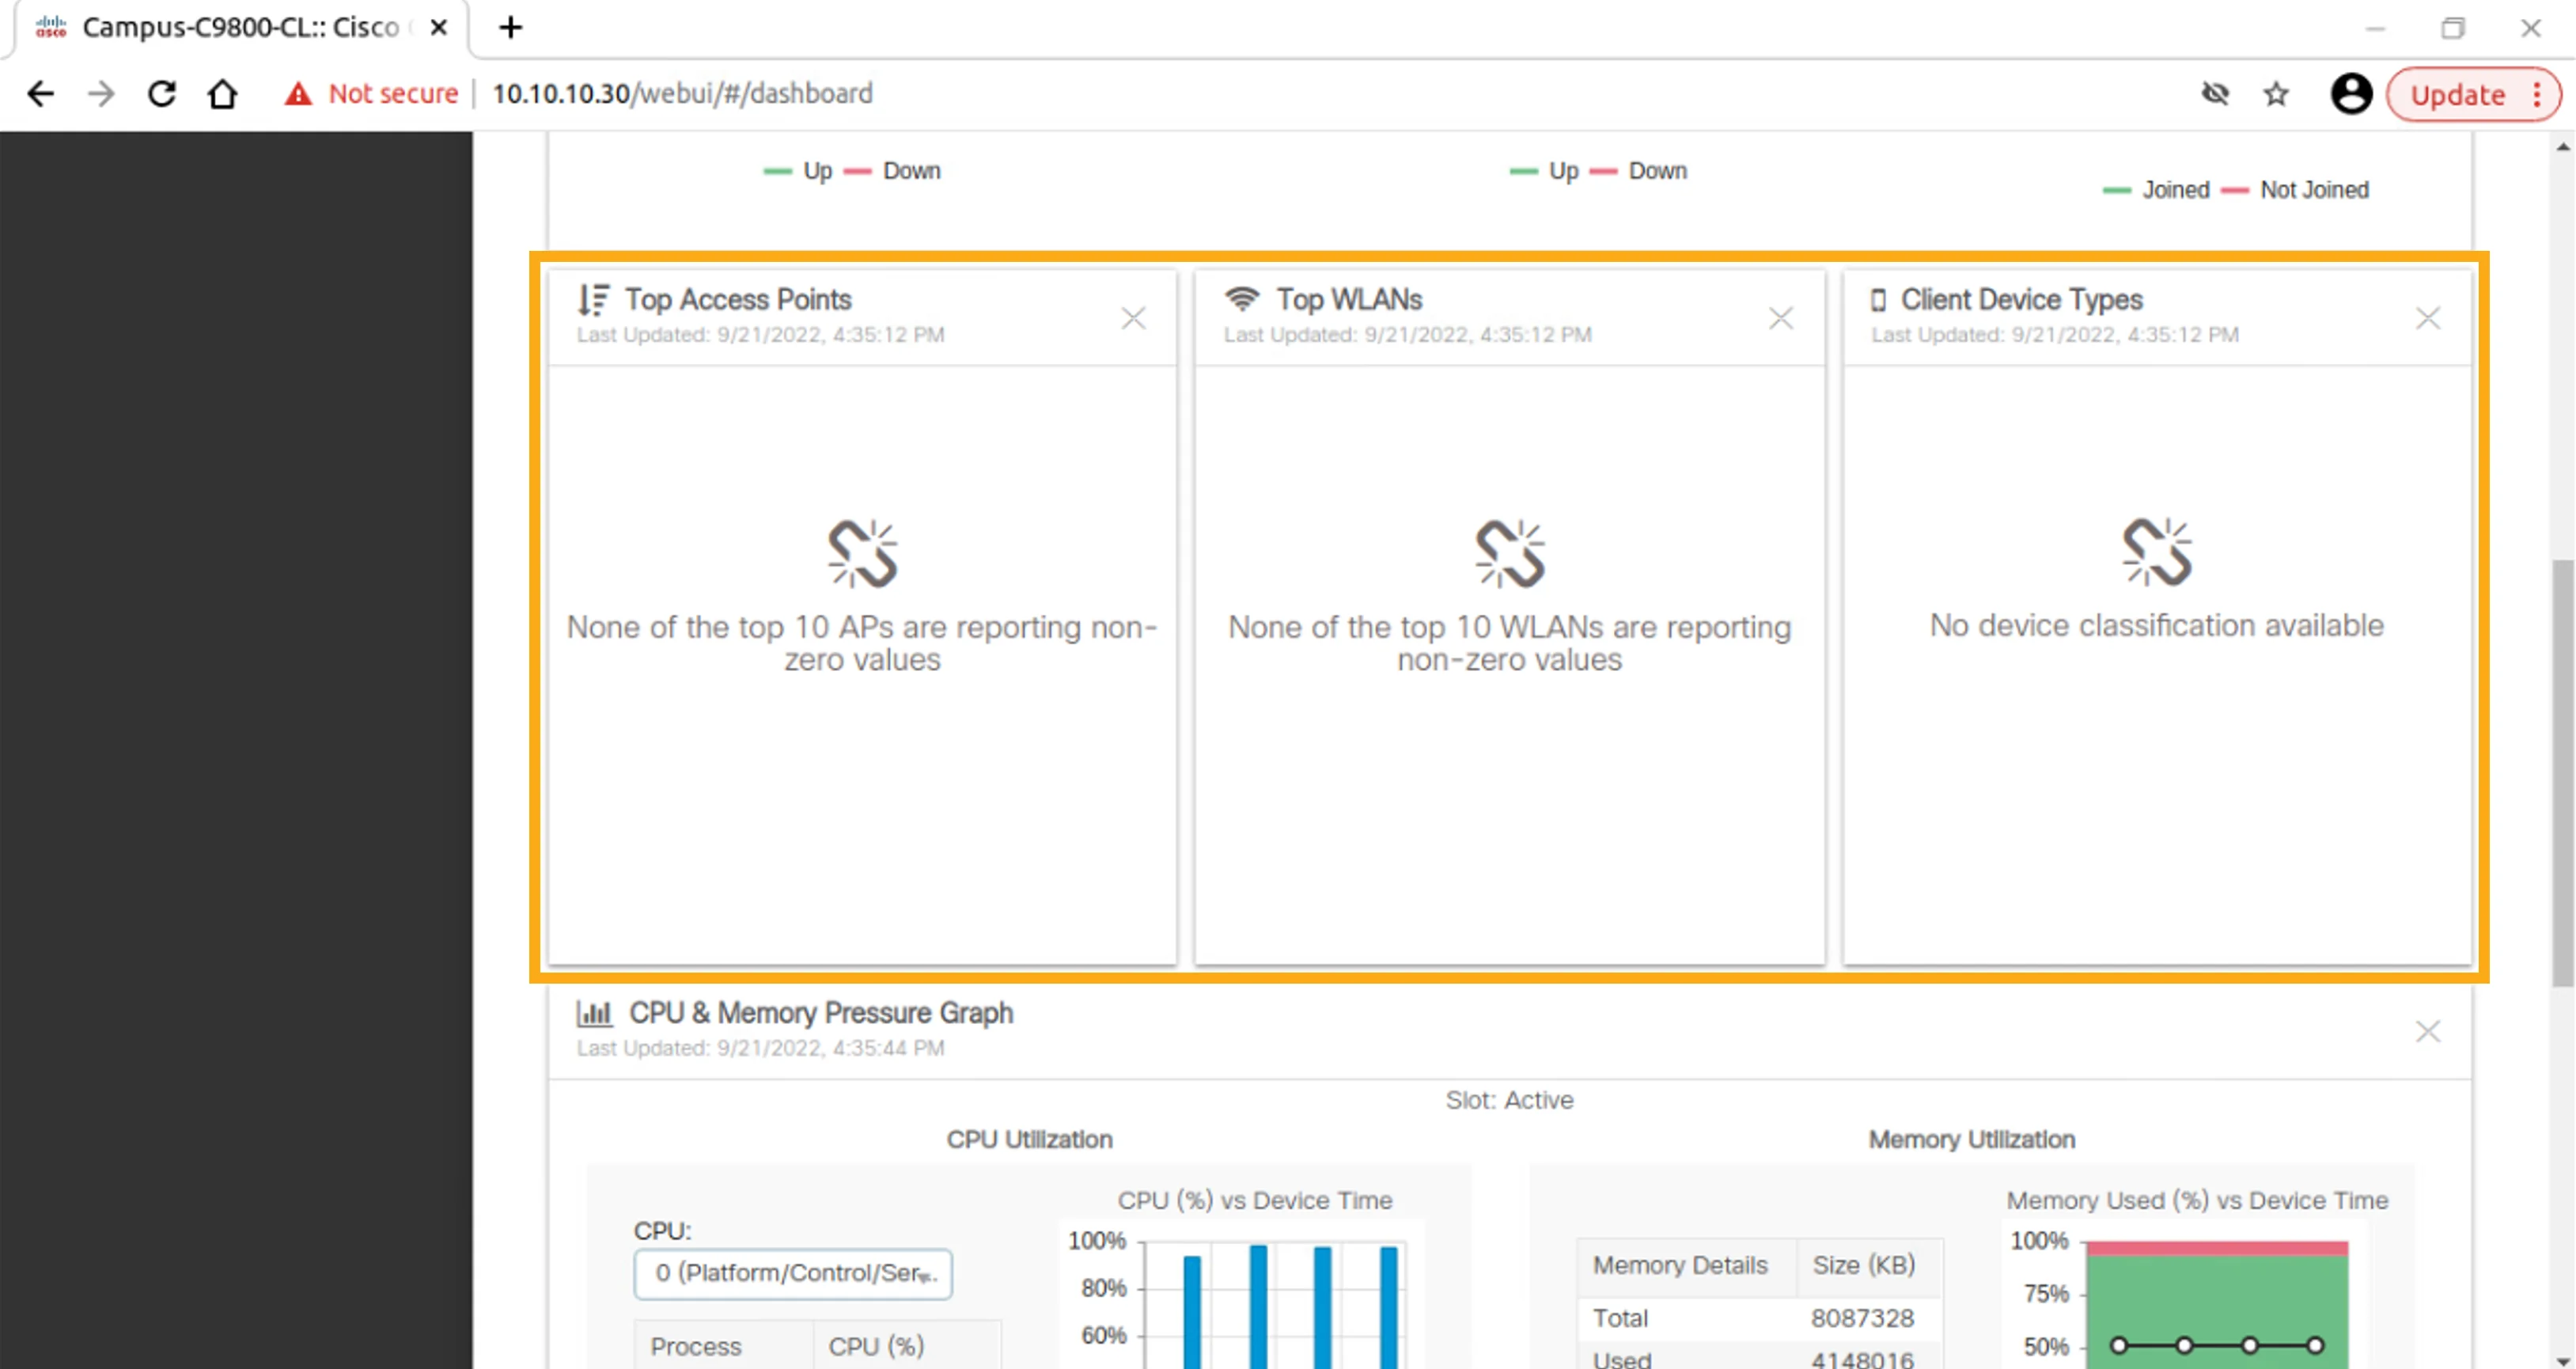
Click in the scroll bar area again to move down the page to see the Top Access Points, Top WLANs, and Client Device Types dashlets.
再次點按捲軸區域向下移動頁面,檢視 Top Access Points、Top WLANs 與 Client Device Types 小工具。
Currently, these dashlets do not report any values because of the incomplete configuration and lack of clients.
目前由於設定尚未完成且沒有用戶端,這些小工具尚未回報任何數值。
Click in the scroll bar area to move down the page to the CPU & Memory Pressure Graph, which provides information about resource utilization.
點按捲軸區域向下移動頁面,前往 CPU & Memory Pressure Graph,其中提供資源使用率資訊。
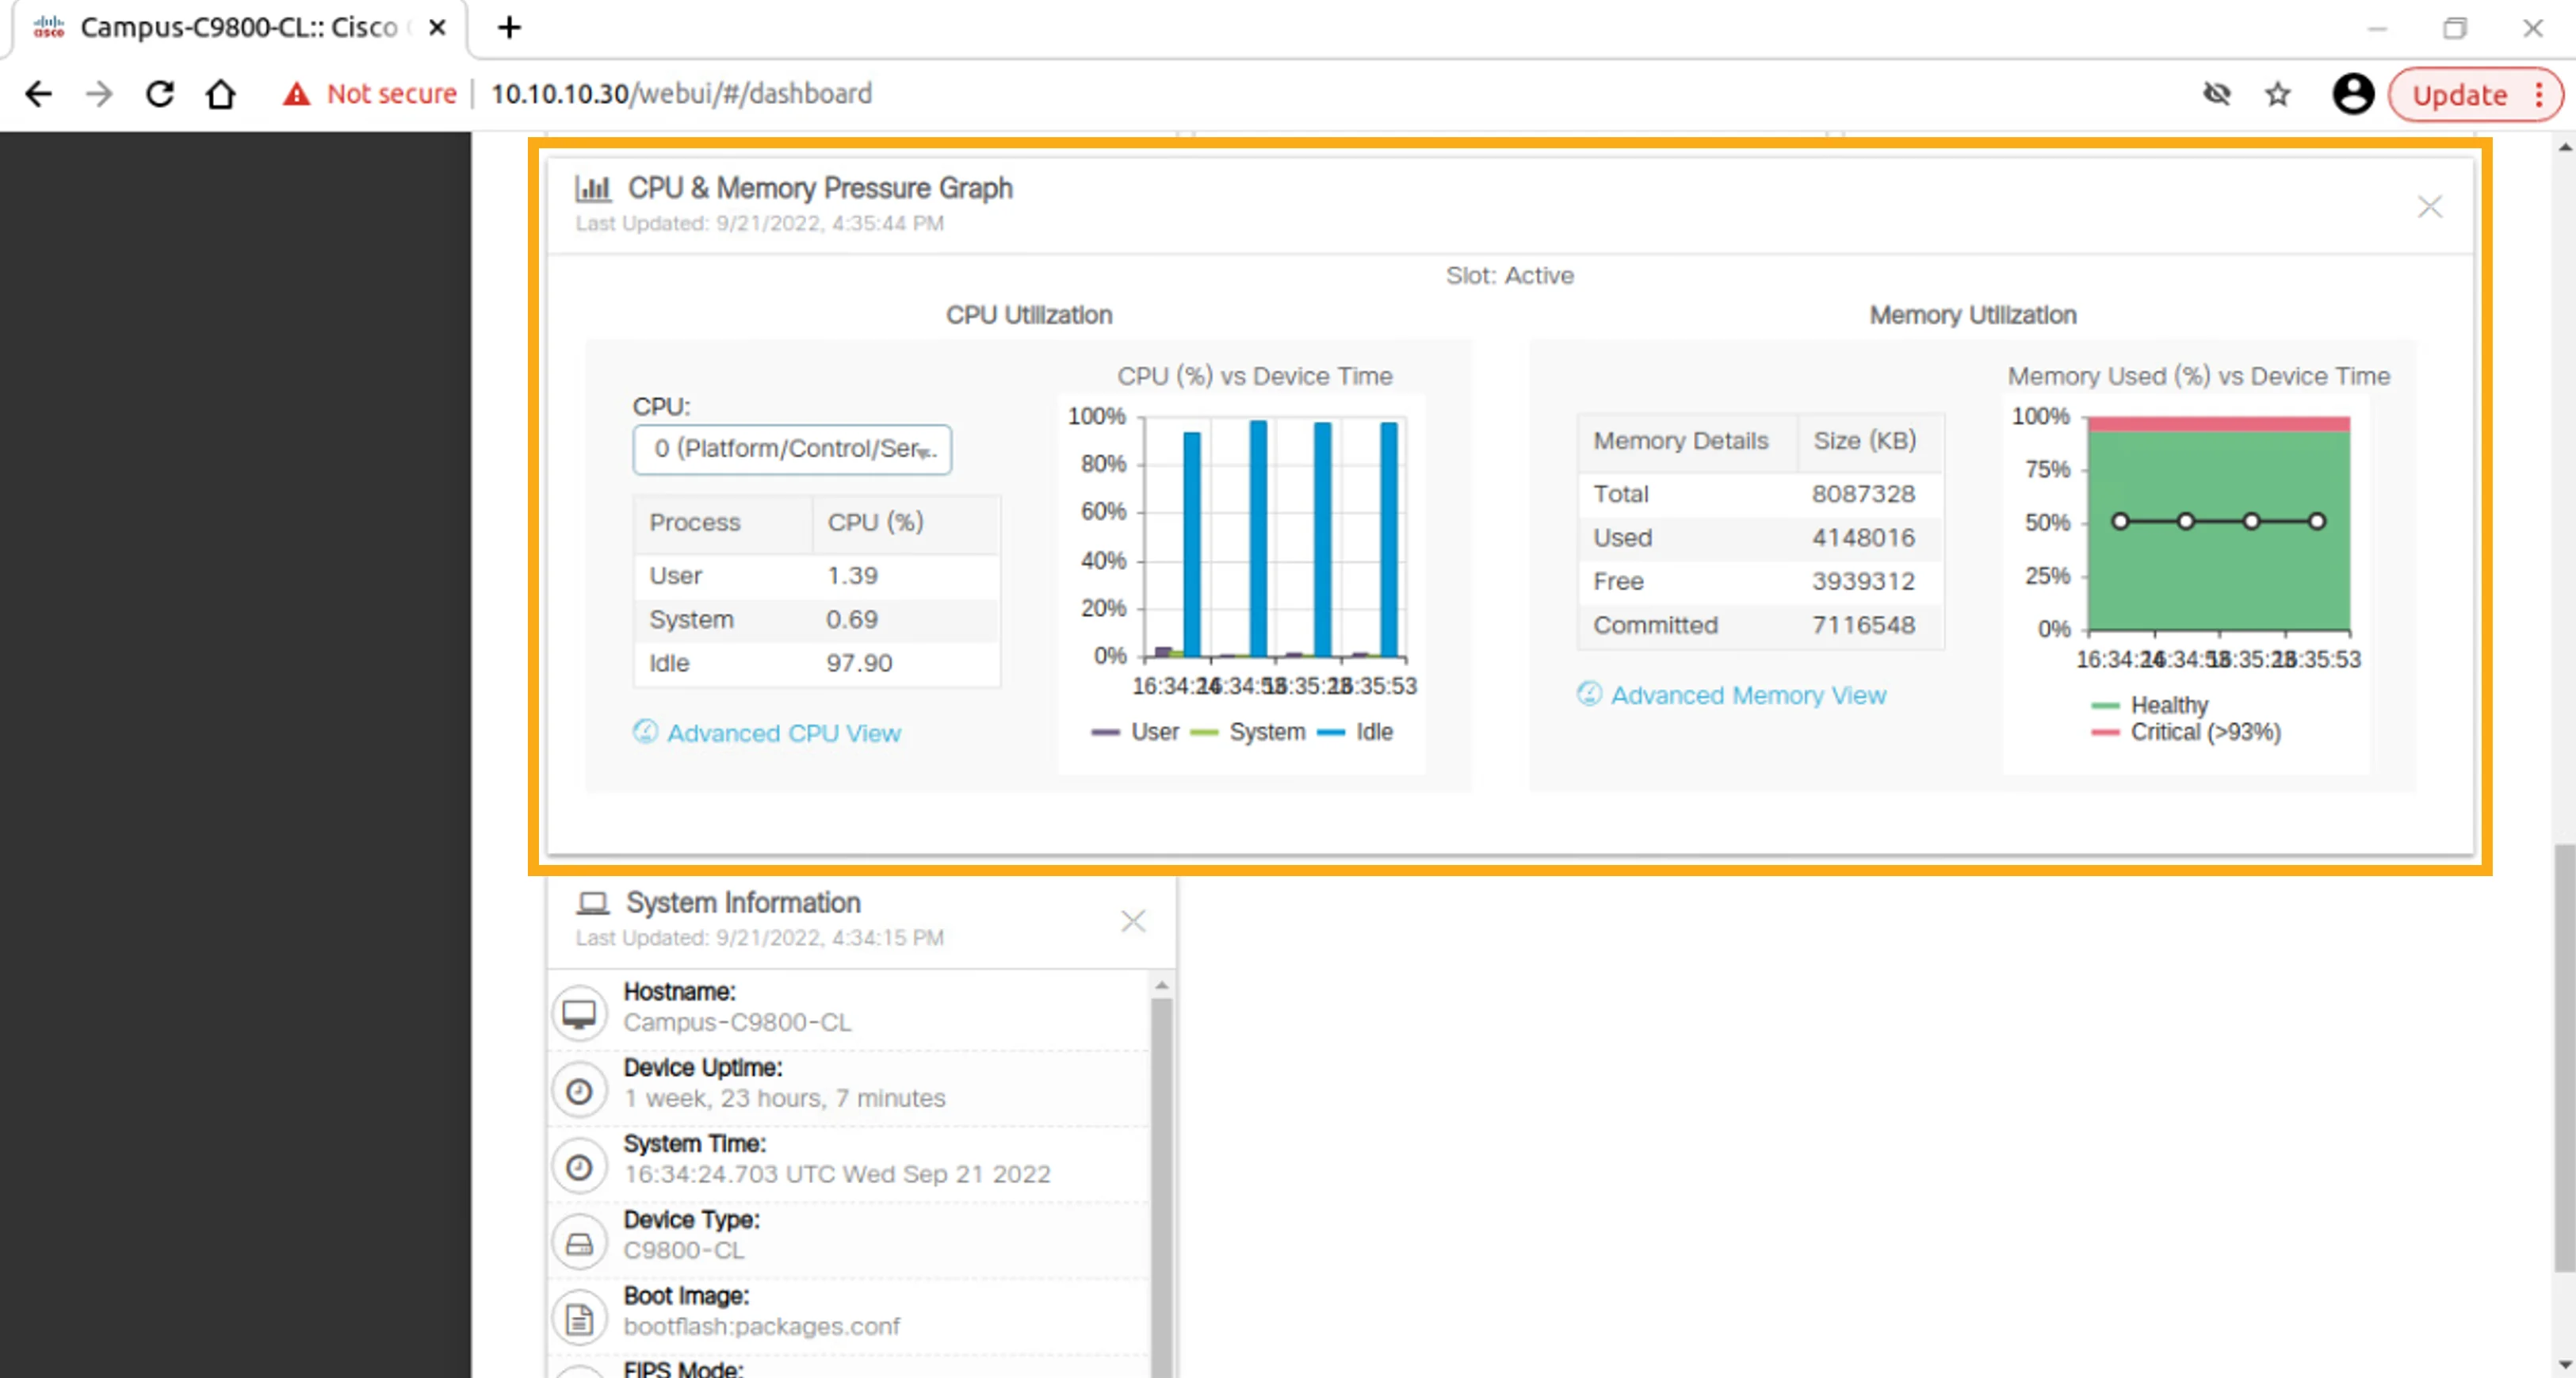
Click in the scroll bar area to move down the page to the System Information dashlet.
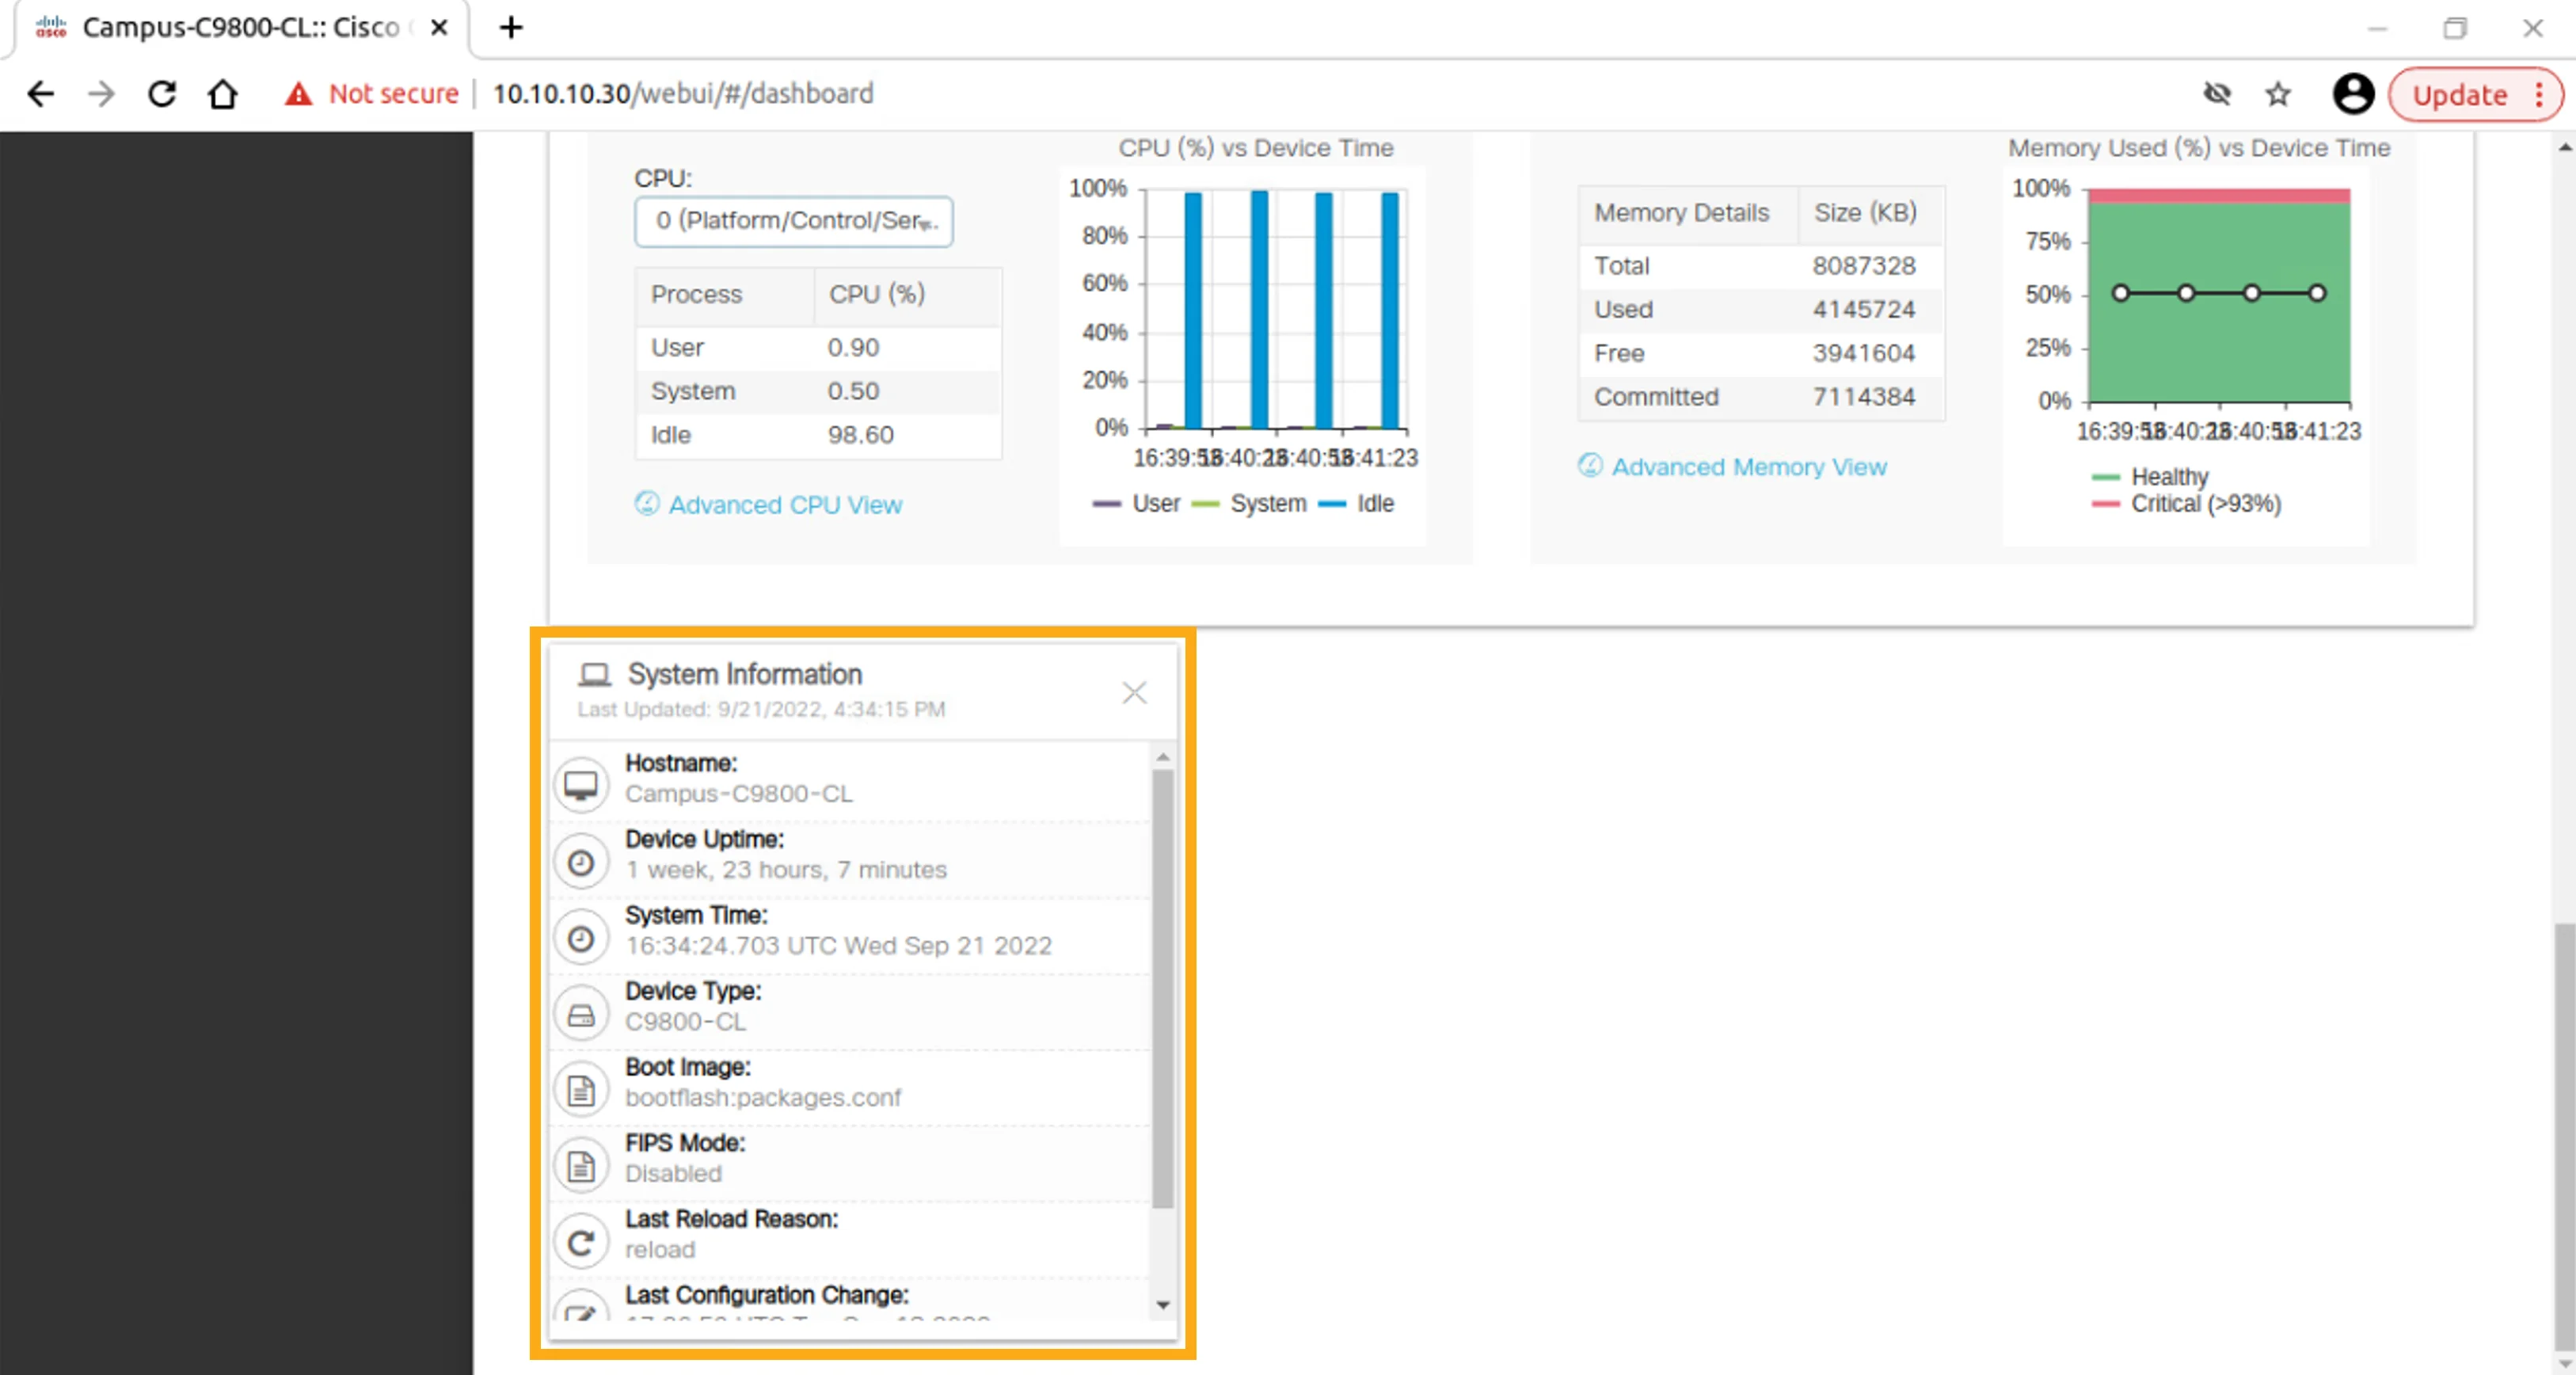
點按捲軸區域向下移動頁面,前往 System Information 小工具。
This dashlet provides system data, including the hostname of the WLC, its uptime, the system time, device type, boot image, FIPS mode, last reload reason, last configuration change, and redundancy mode.
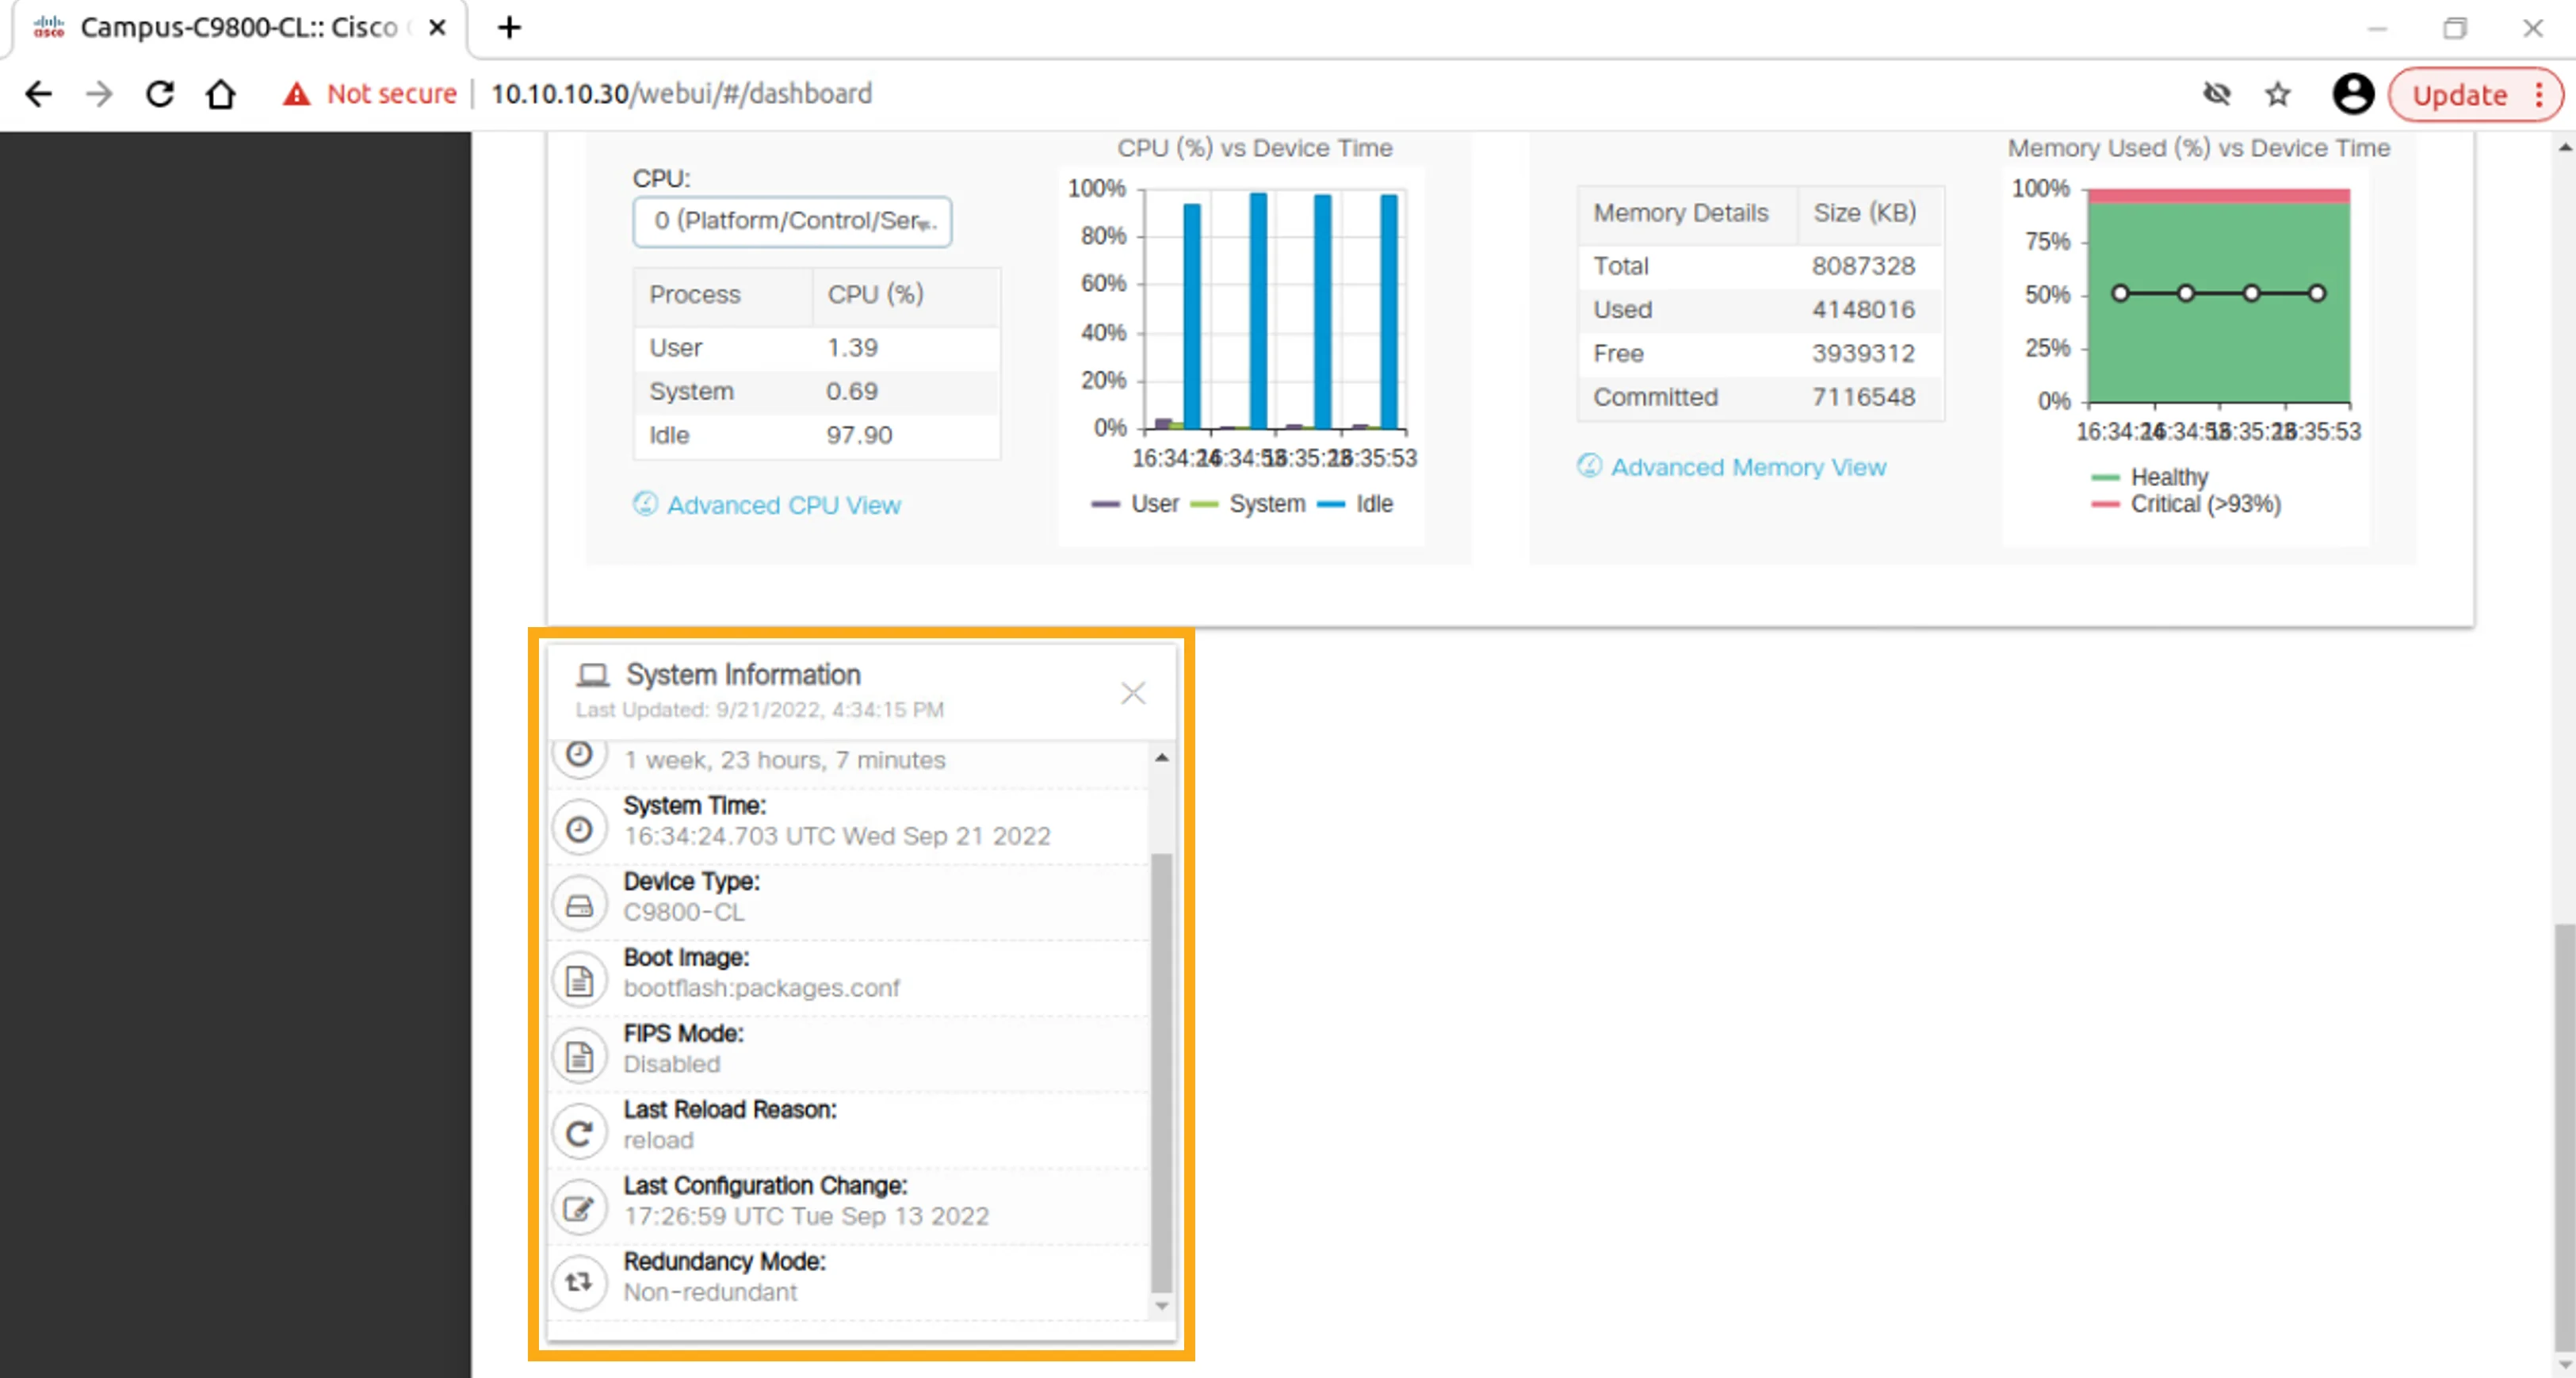
此小工具提供系統資料,包括 WLC 的主機名稱、運作時間、系統時間、裝置類型、開機映像檔、FIPS 模式、上次重新載入原因、上次設定變更時間,以及備援模式。
In the System Information dashlet, click in the scroll bar area to move down the page so that you can see the remaining elements of the dashlet.
在 System Information 小工具中,點按捲軸區域向下移動頁面,以便檢視該小工具其餘的項目。
Task 2: Monitor the WLC
任務 2:監控 WLC
Monitoring network components is an important task. Cisco WLCs provide a rich set of monitoring capabilities. In the following steps, you will explore some of the monitoring features of the Cisco Catalyst 9800 WLC.
監控網路元件是一項重要工作。Cisco WLC 提供豐富的監控功能。在以下步驟中,你將探索 Cisco Catalyst 9800 WLC 的部分監控功能。
Activity
活動
Scroll back up to the top of the Dashboard GUI page. To do so, from the bottom of the Dashboard GUI page, click twice in the scroll bar area to the right.
捲動回儀表板圖形介面頁面的頂端。作法是從儀表板圖形介面頁面的底部,點按右側的捲軸區域兩次。
Here is the top of the page.
以下是頁面的頂端。
Choose Monitoring > General > System to open the System monitoring page.
選擇 Monitoring > General > System,開啟 System 監控頁面。
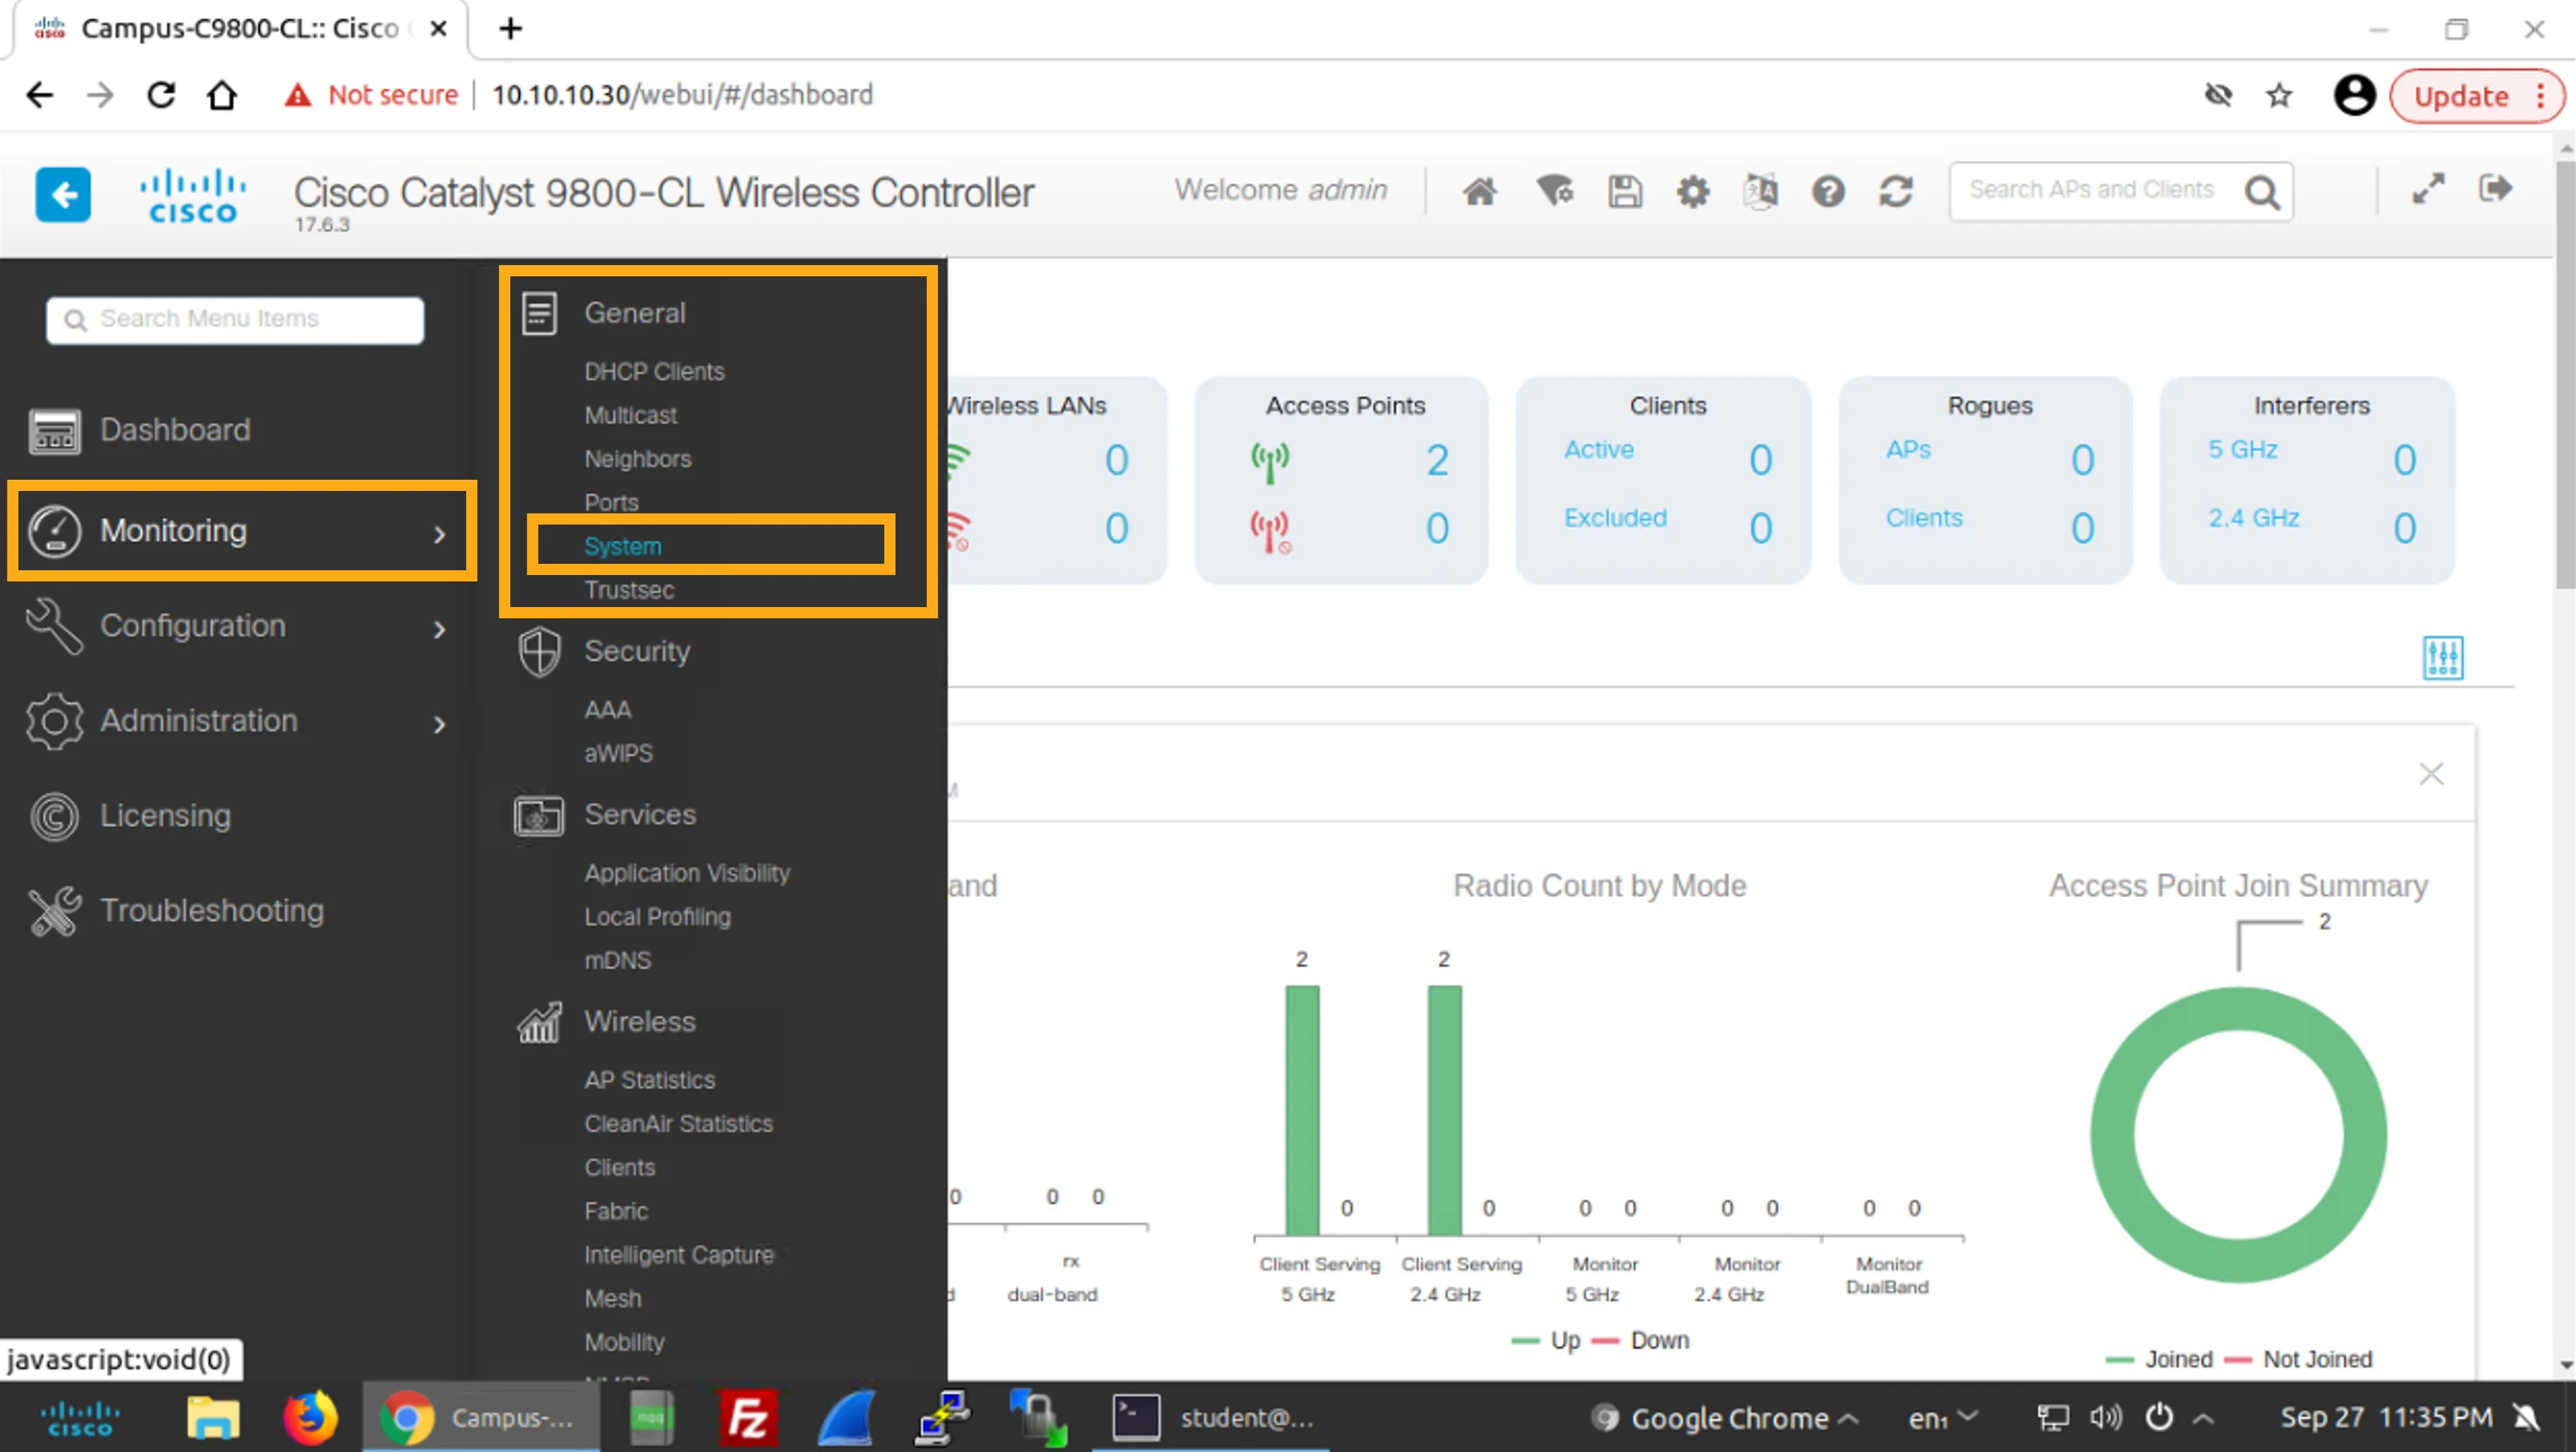
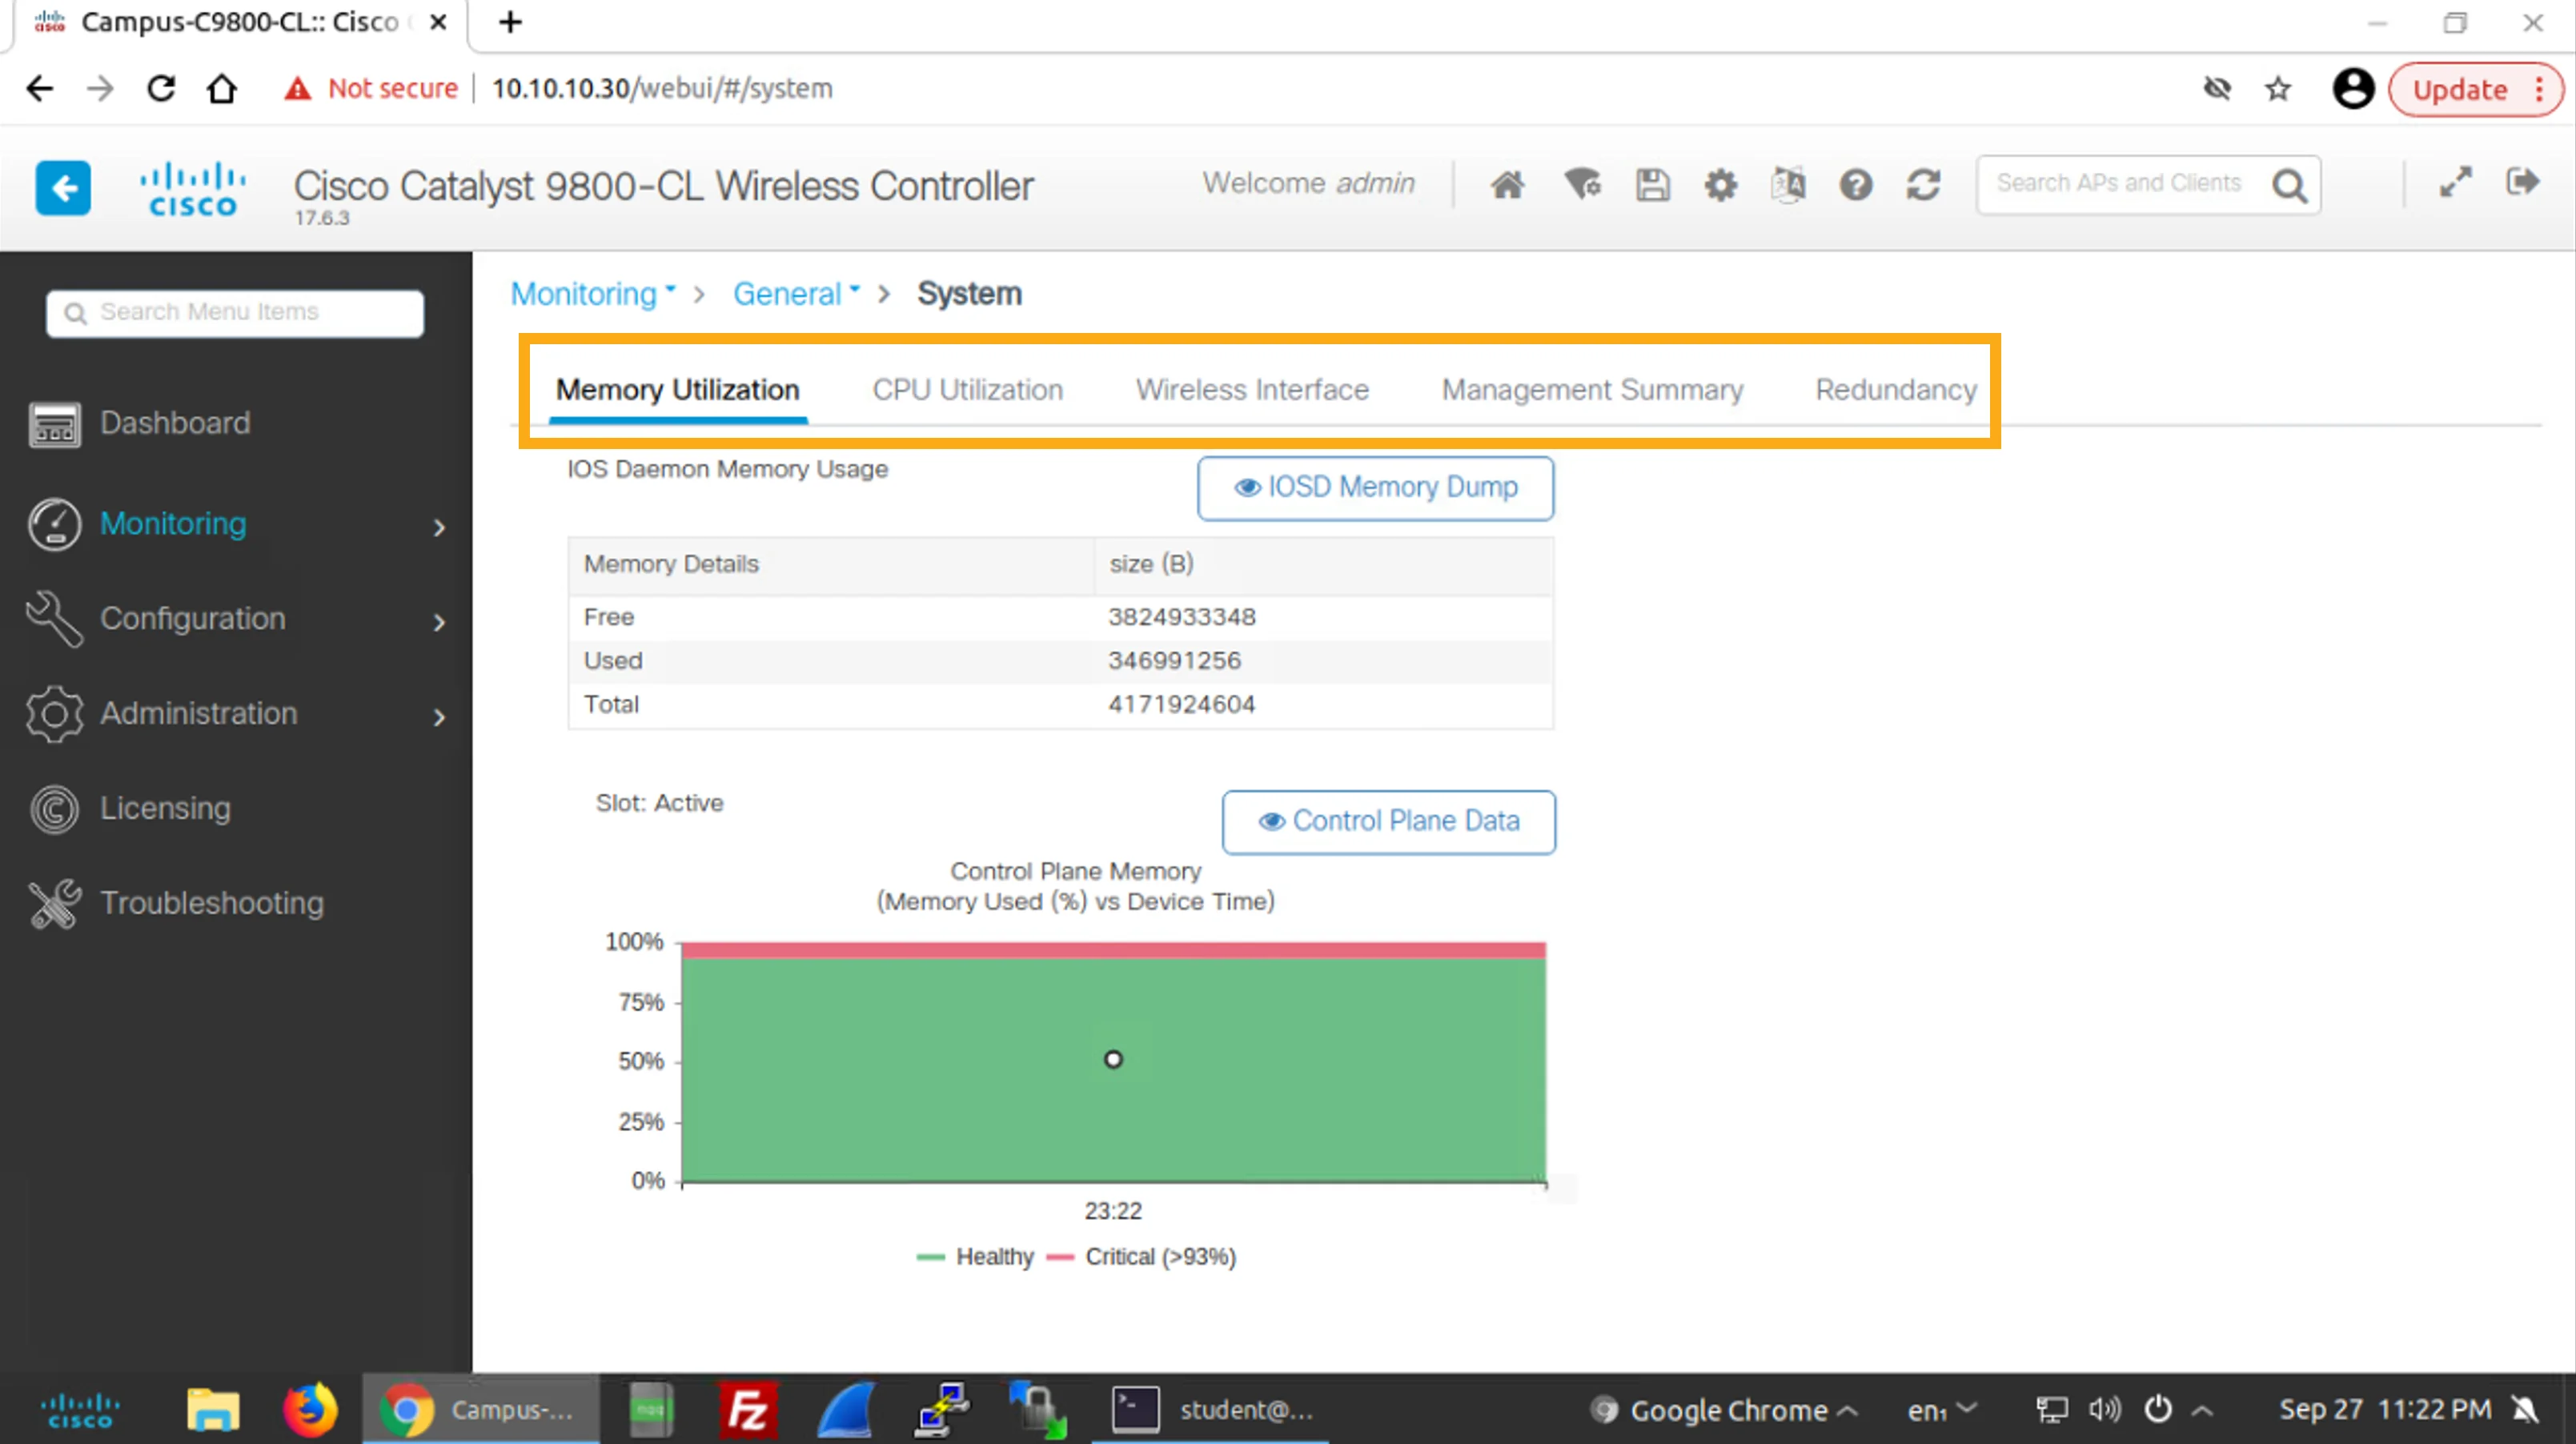
Identify the main categories on the System monitoring page.
找出 System 監控頁面上的主要類別。
The System monitoring page includes the following categories: Memory Utilization and CPU Utilization, where you can find details about resource utilization; Wireless Interface, which provides a list of the configured VLANs, their types, and IP and MAC addresses; Management Summary, which shows the enabled and disabled management options such as HTTP, HTTPS, and SNMP services; and Redundancy, which provides details about the redundancy configuration and status.
System 監控頁面包含以下類別:Memory Utilization 與 CPU Utilization,可查看資源使用率的詳細資料;Wireless Interface,提供已設定 VLAN 的清單、其類型與 IP、MAC 位址;Management Summary,顯示已啟用與已停用的管理選項,例如 HTTP、HTTPS 與 SNMP 服務;以及 Redundancy,提供備援設定與狀態的詳細資料。
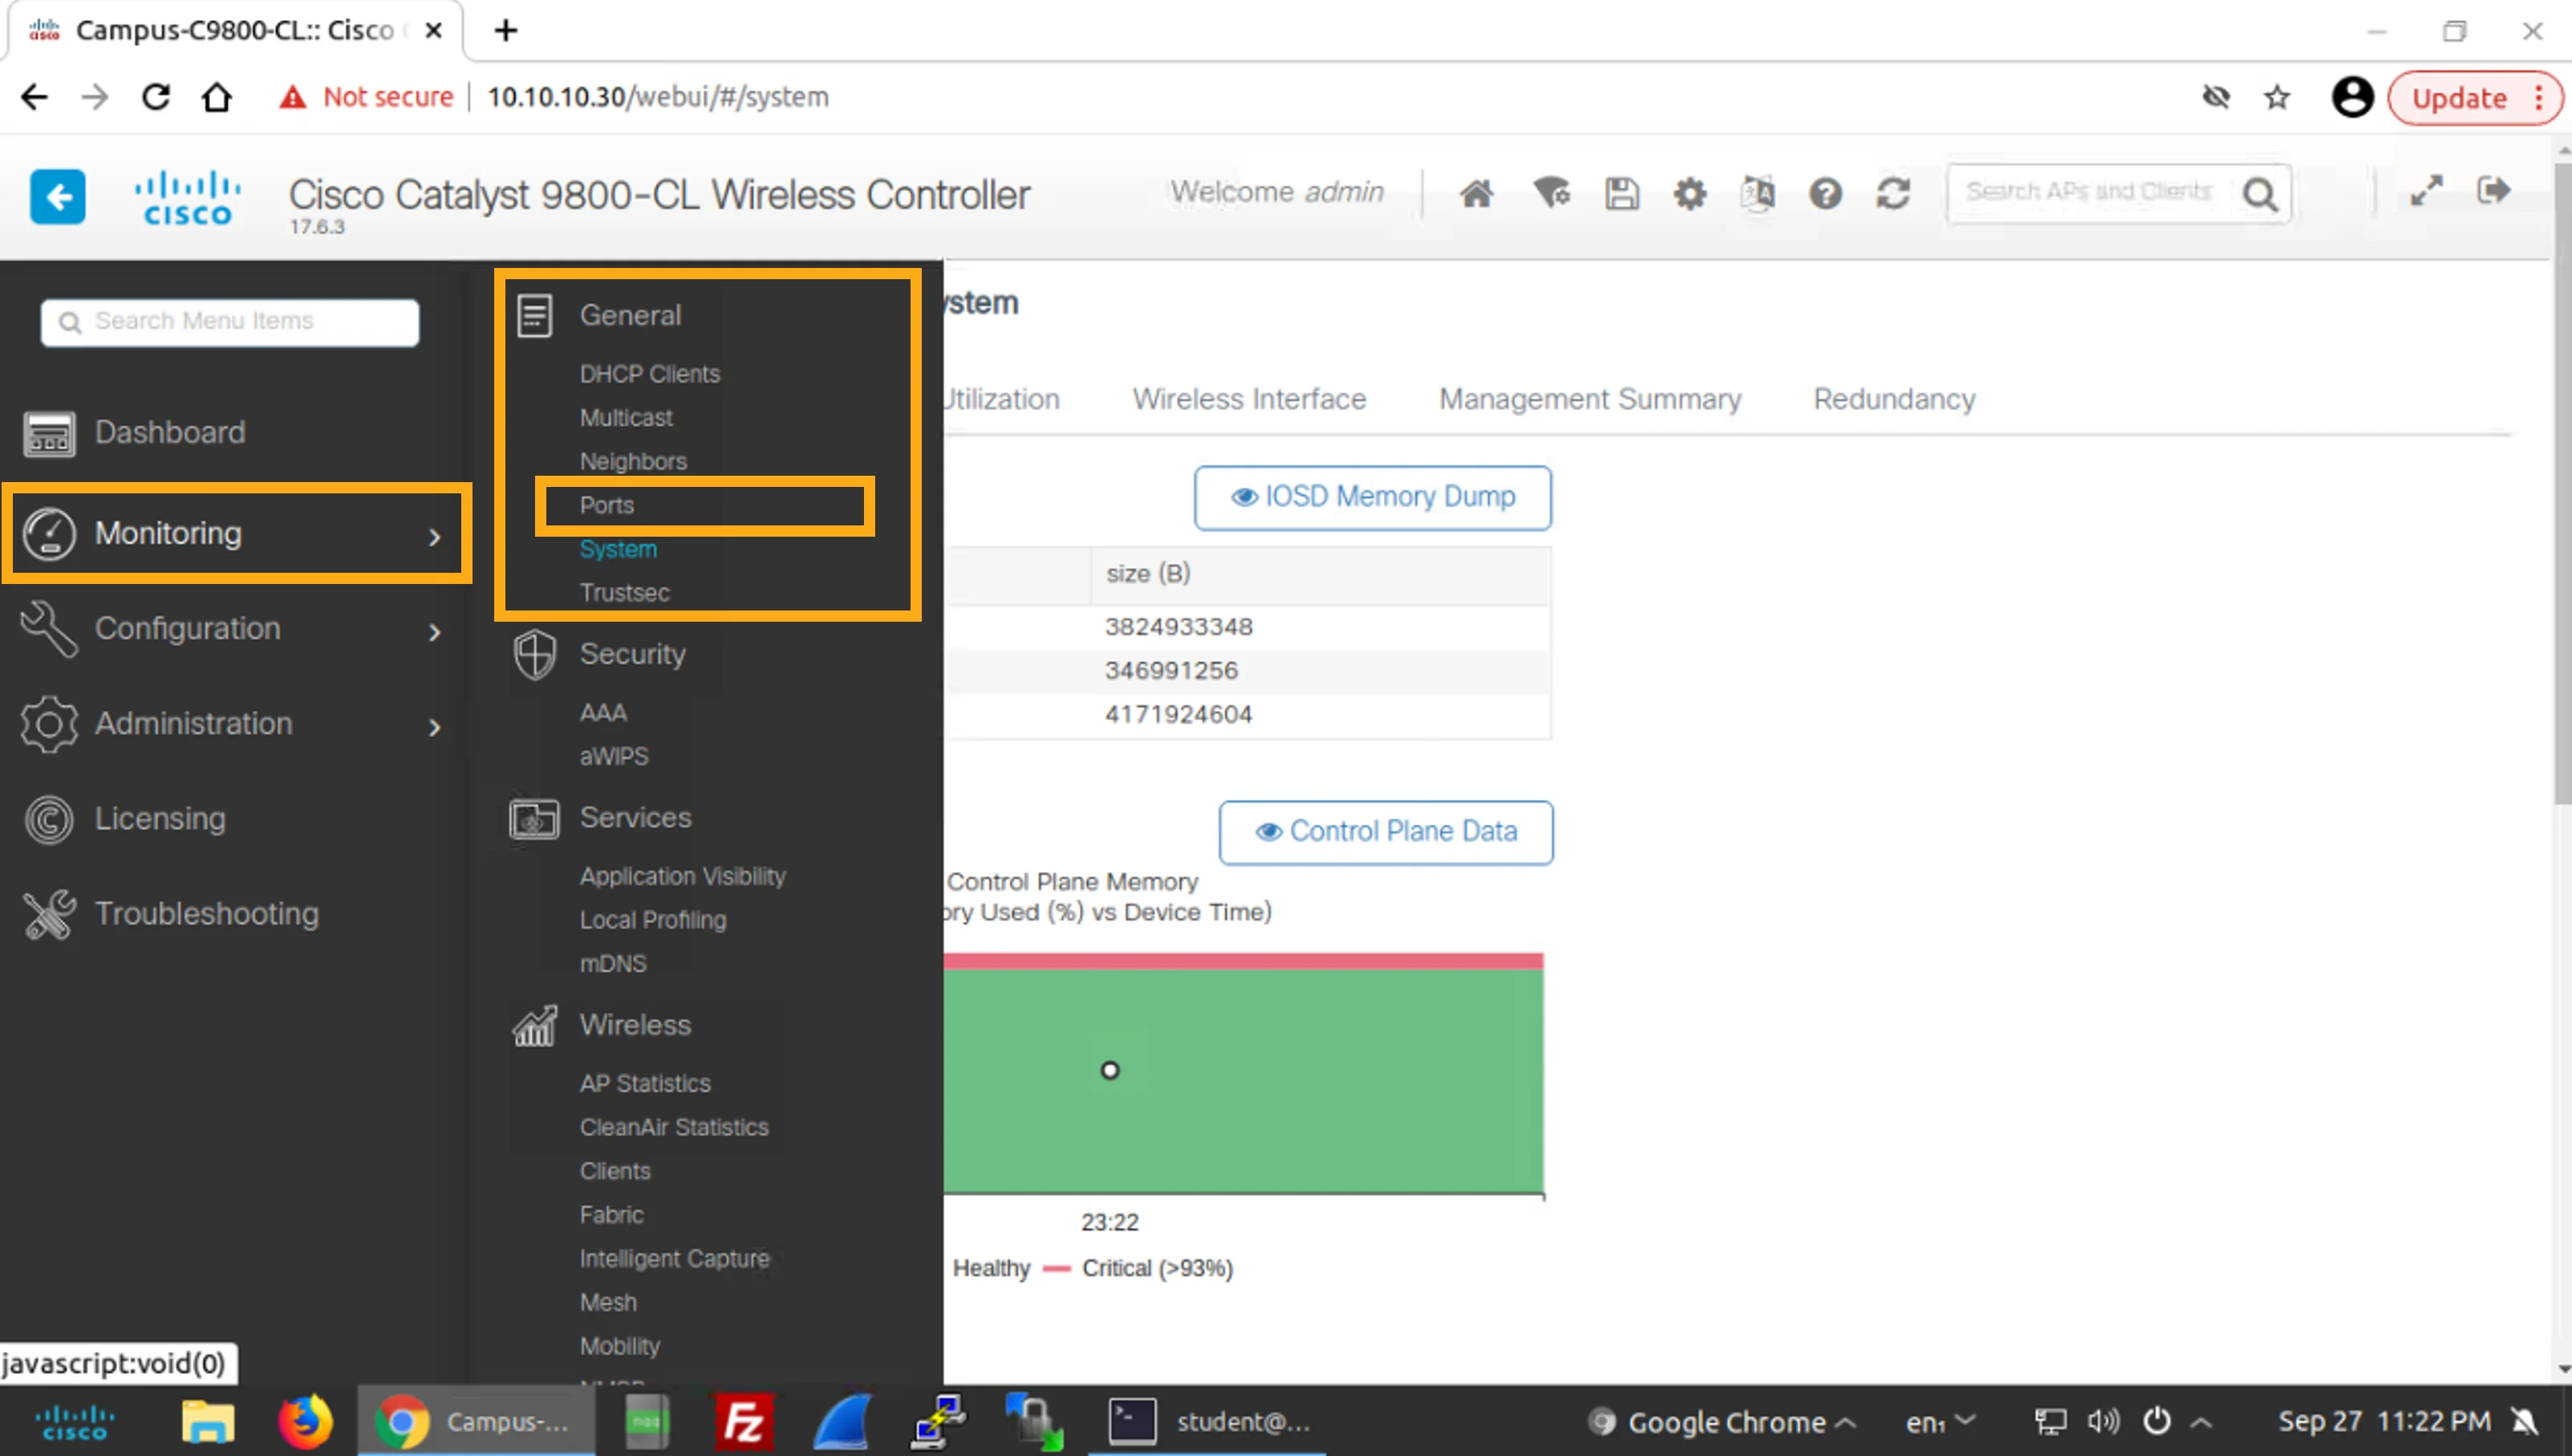
Choose Monitoring > General > Ports to open the Ports monitoring page.
選擇 Monitoring > General > Ports,開啟 Ports 監控頁面。
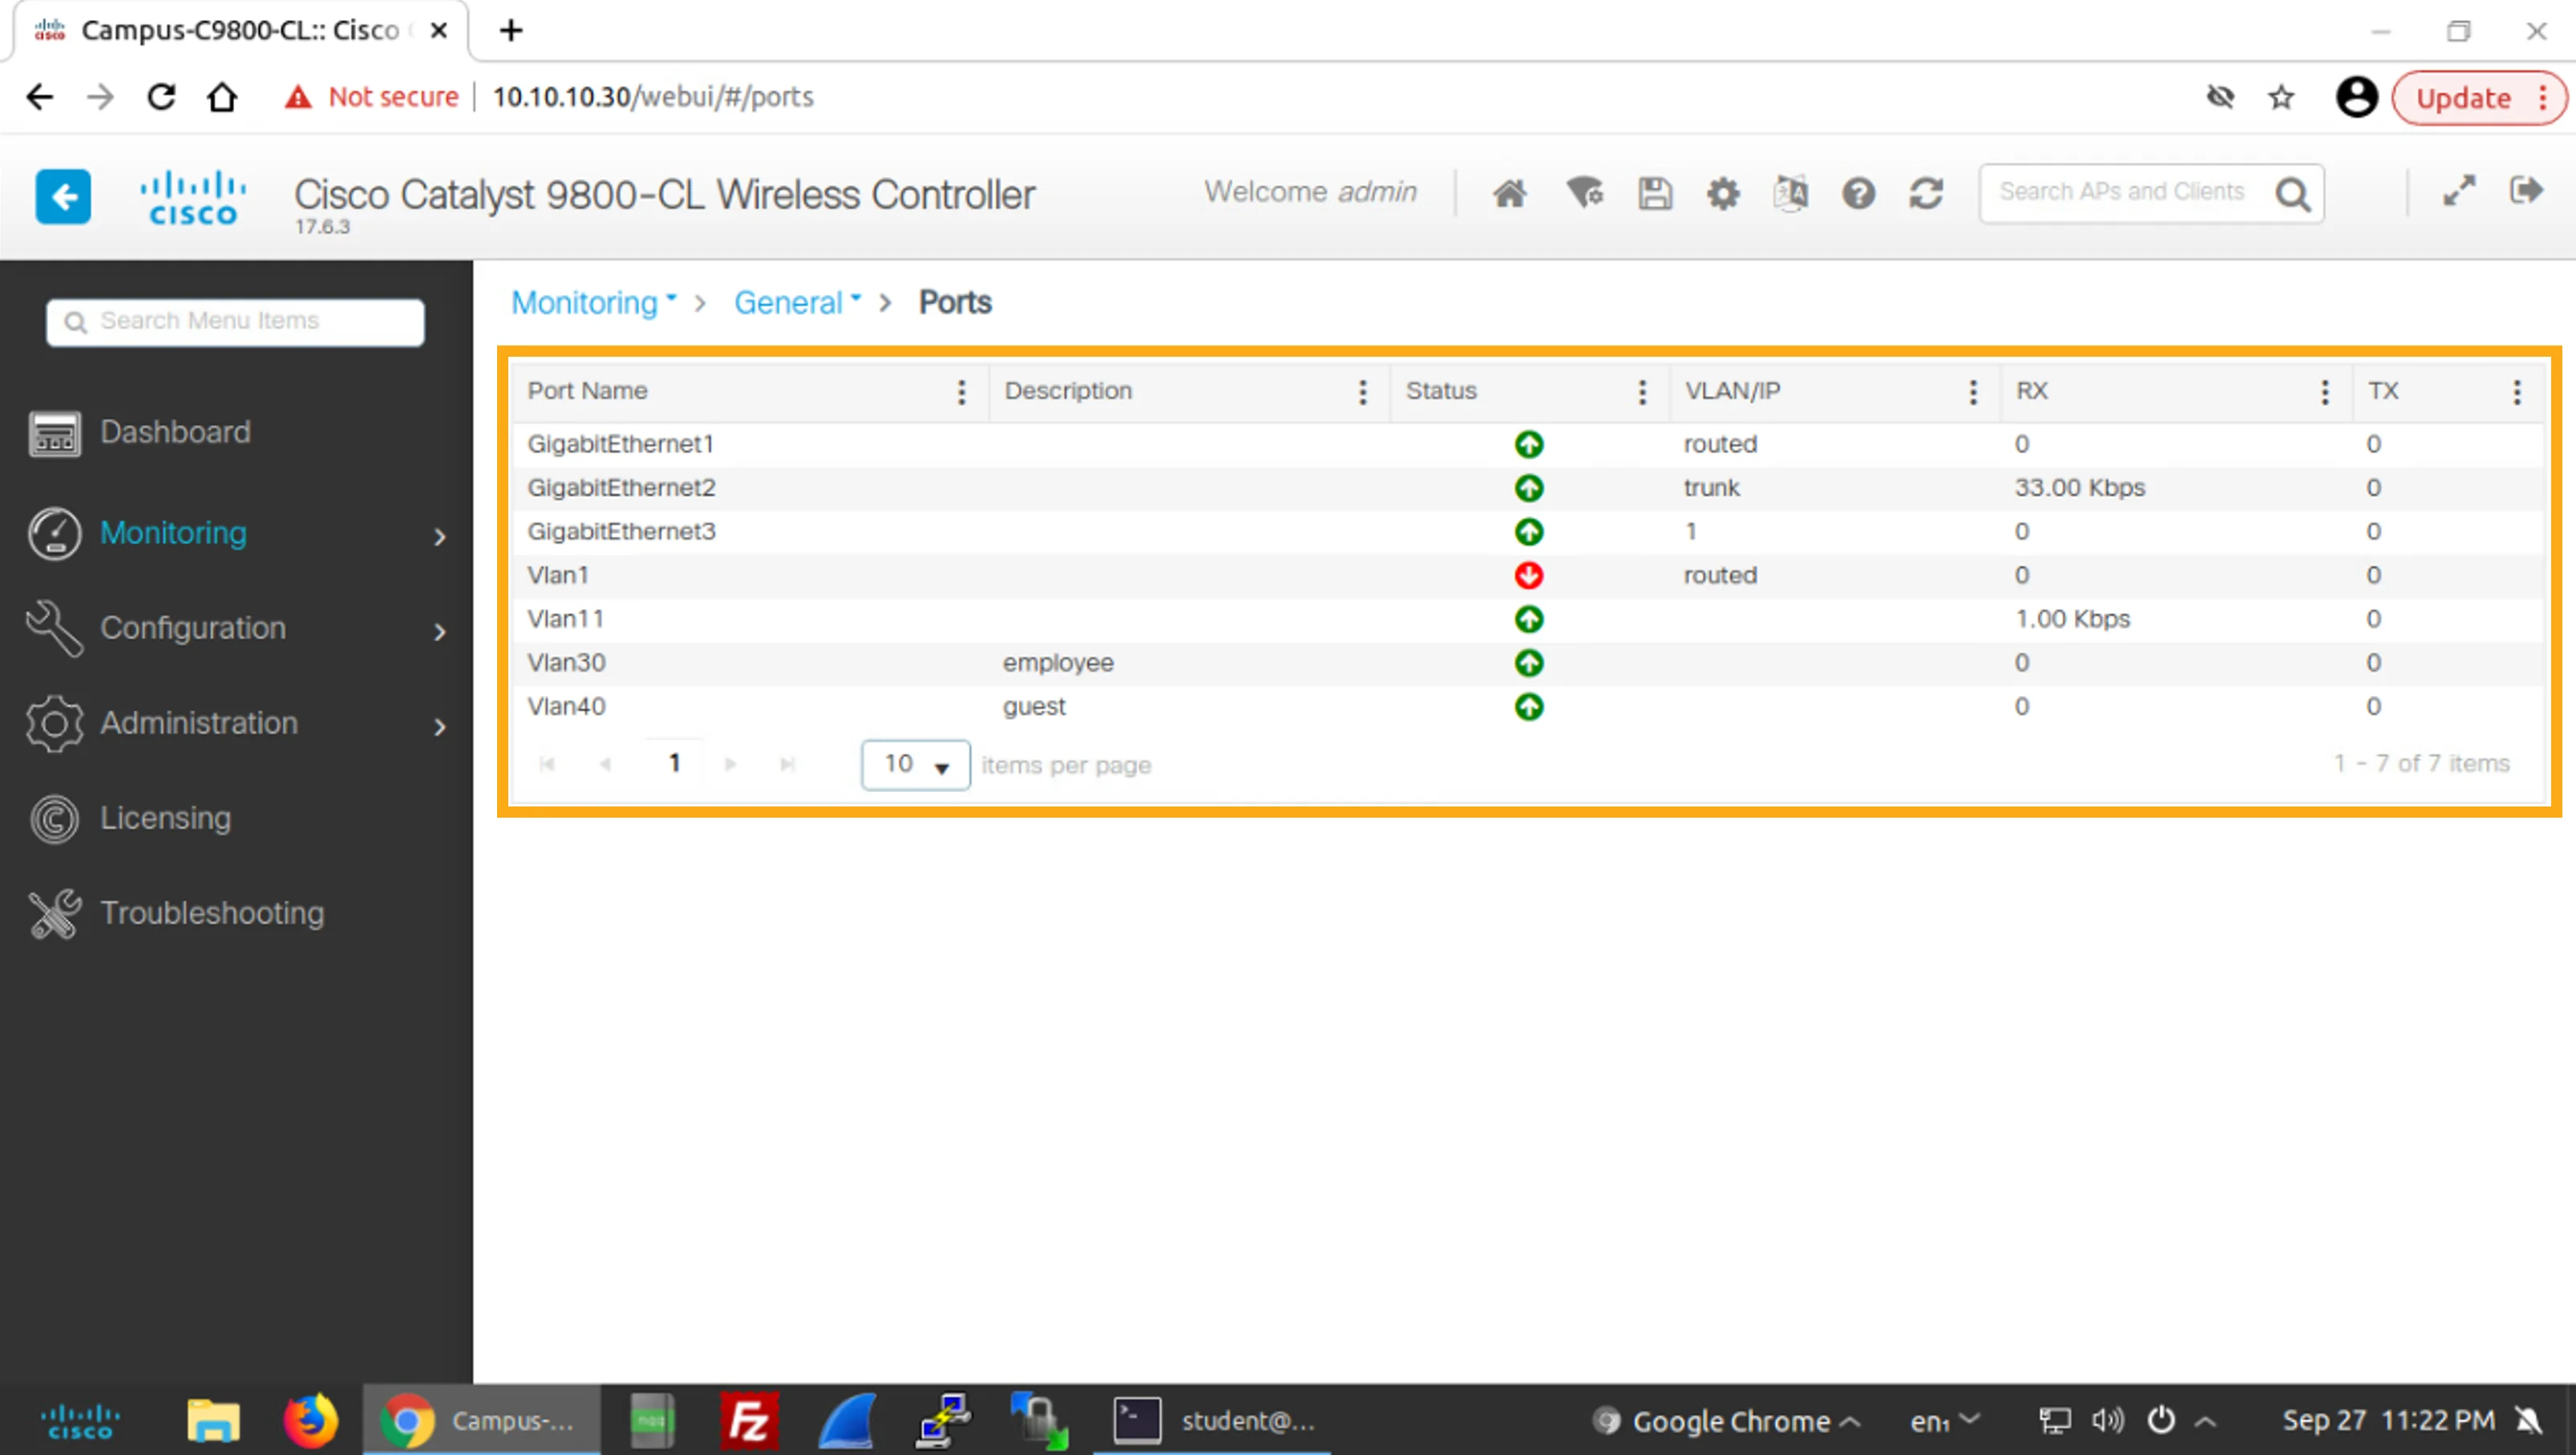
Examine the list of ports.
檢視連接埠清單。
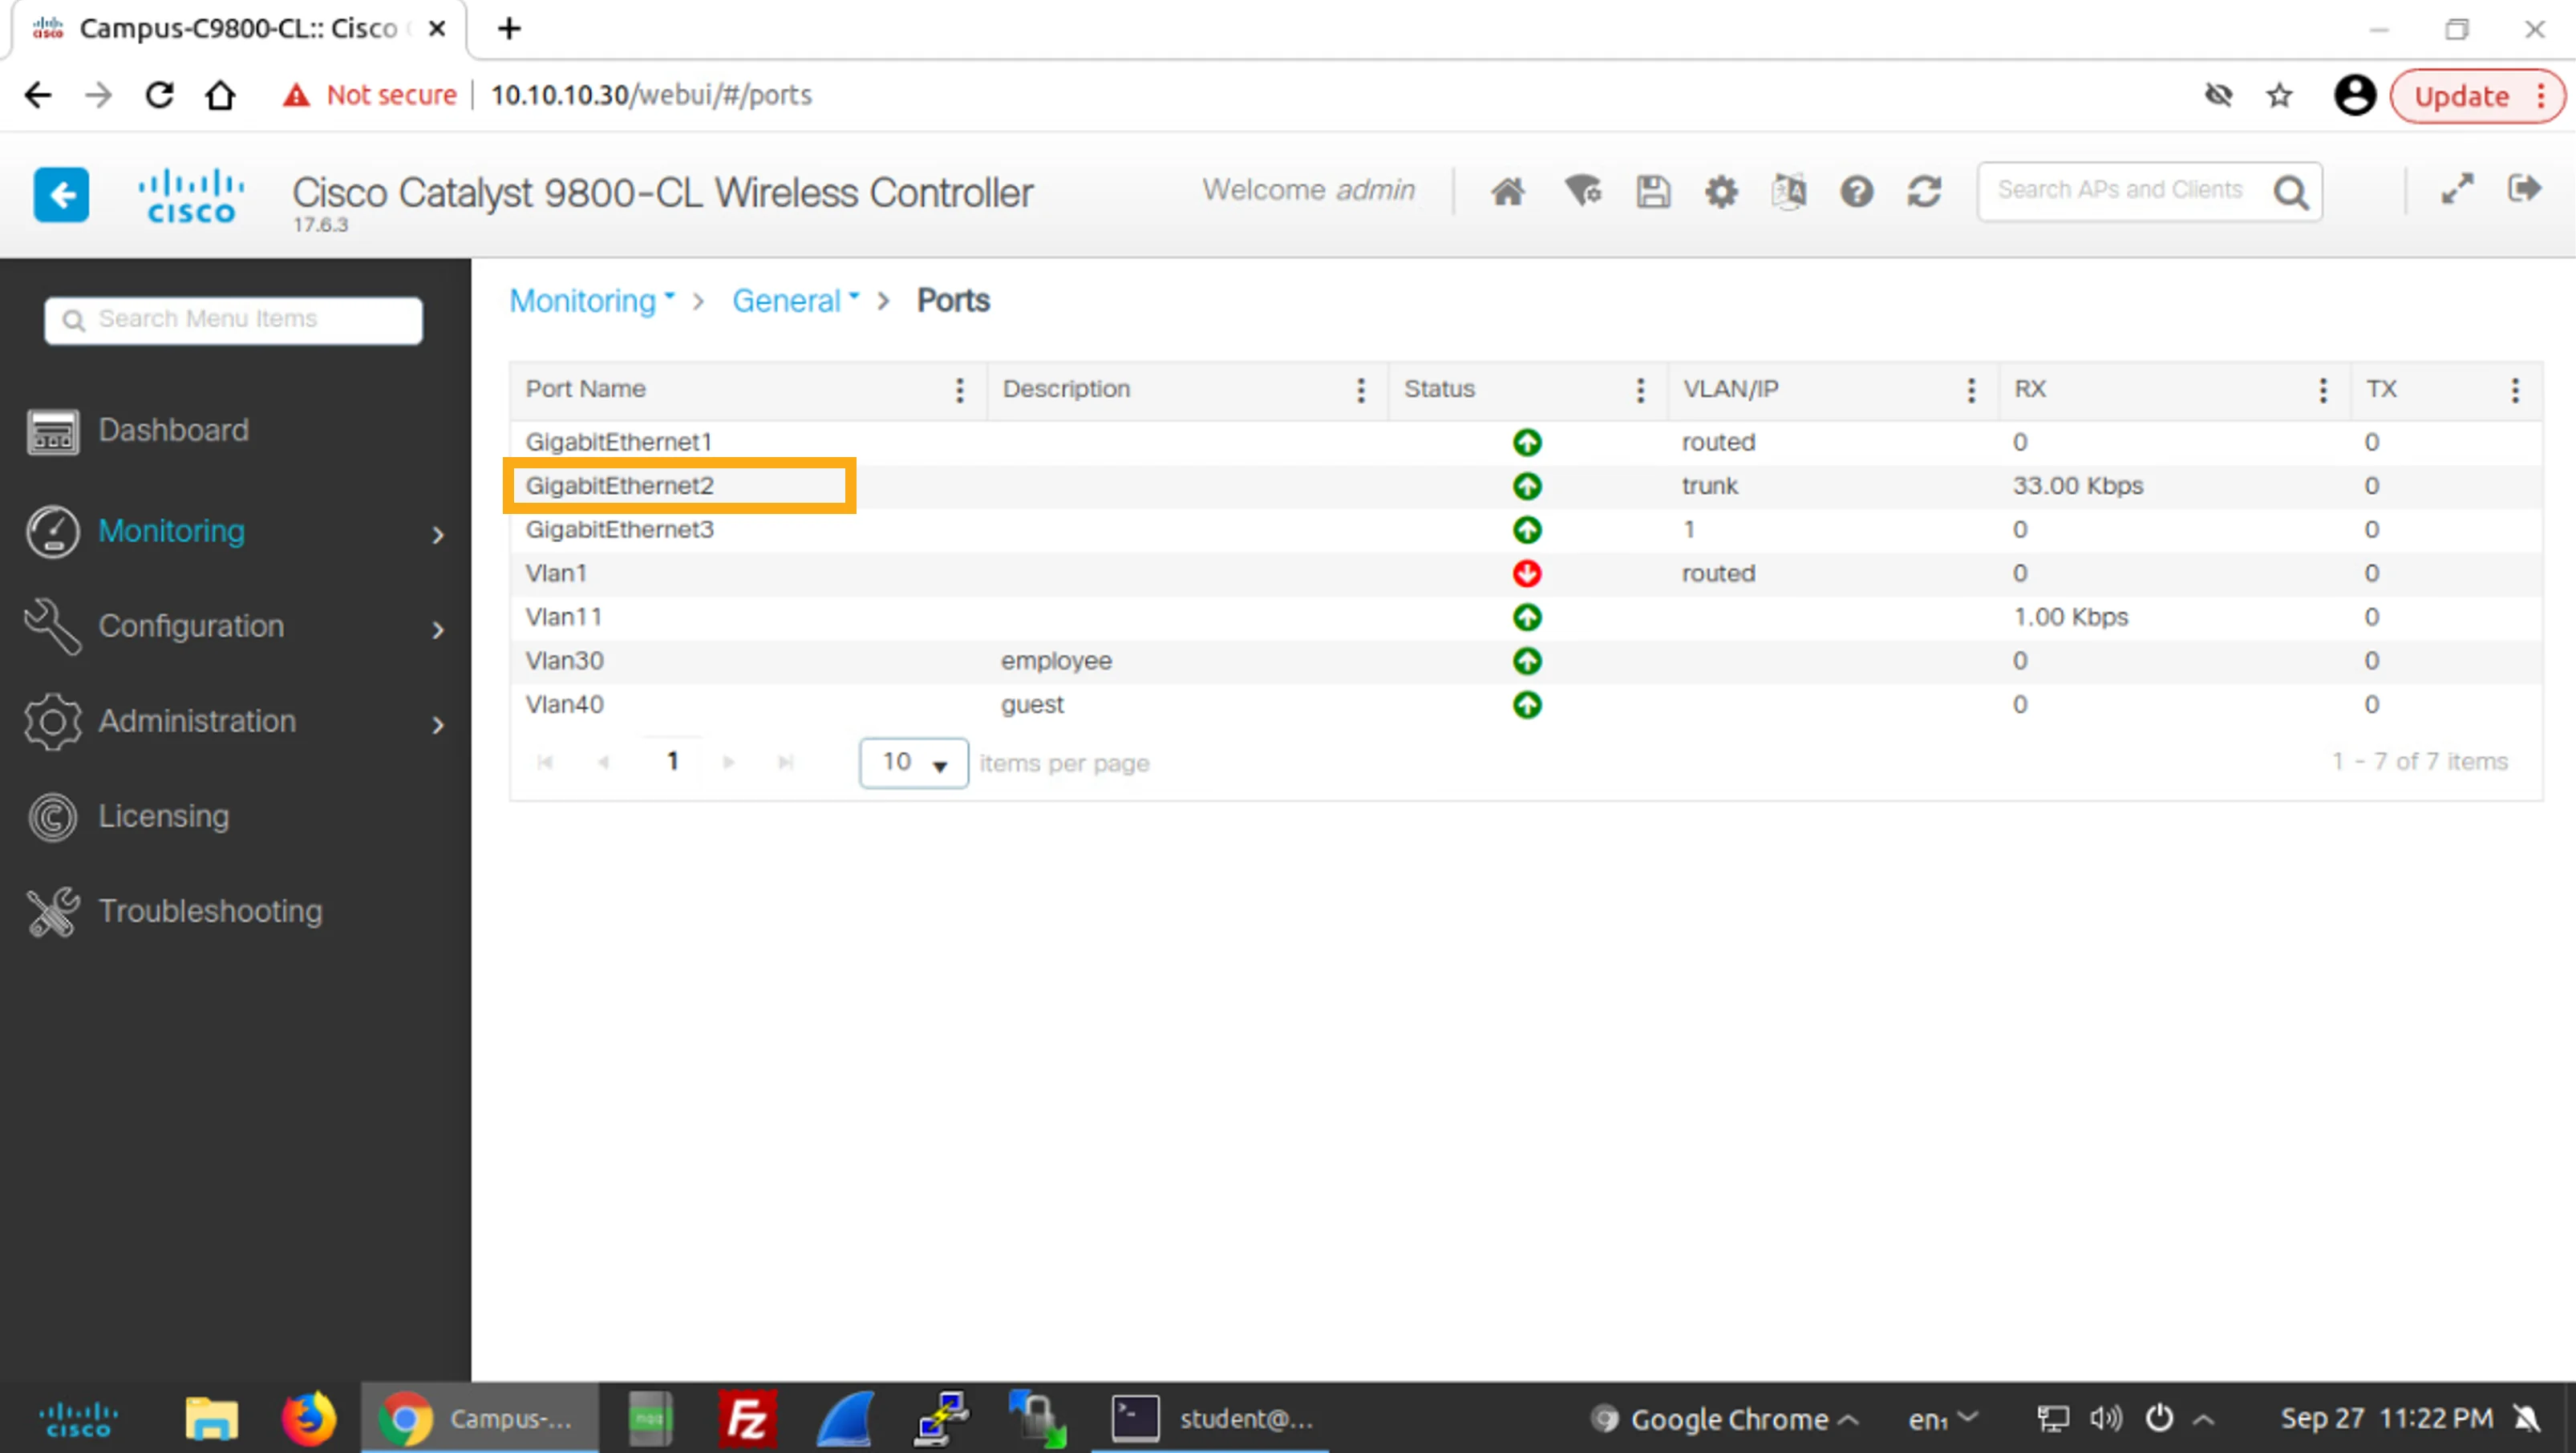
The list includes the physical ports (GigabitEthernet1 to GigabitEthernet3) of the WLC and the configured VLANs (Vlan1, Vlan11, Vlan30, and Vlan40 in this lab). Note the different types of ports: GigabitEthernet1 is a routed port, GigabitEthernet2 is a trunk, and GigabitEthernet3 is a member of Vlan1.
此清單包括 WLC 的實體連接埠(GigabitEthernet1 至 GigabitEthernet3)以及已設定的 VLAN(本實驗中為 Vlan1、Vlan11、Vlan30 與 Vlan40)。請注意各連接埠的不同類型:GigabitEthernet1 為路由埠,GigabitEthernet2 為中繼埠,GigabitEthernet3 為 Vlan1 的成員埠。
Click the GigabitEthernet2 port to display input and output information and the general settings of the port.
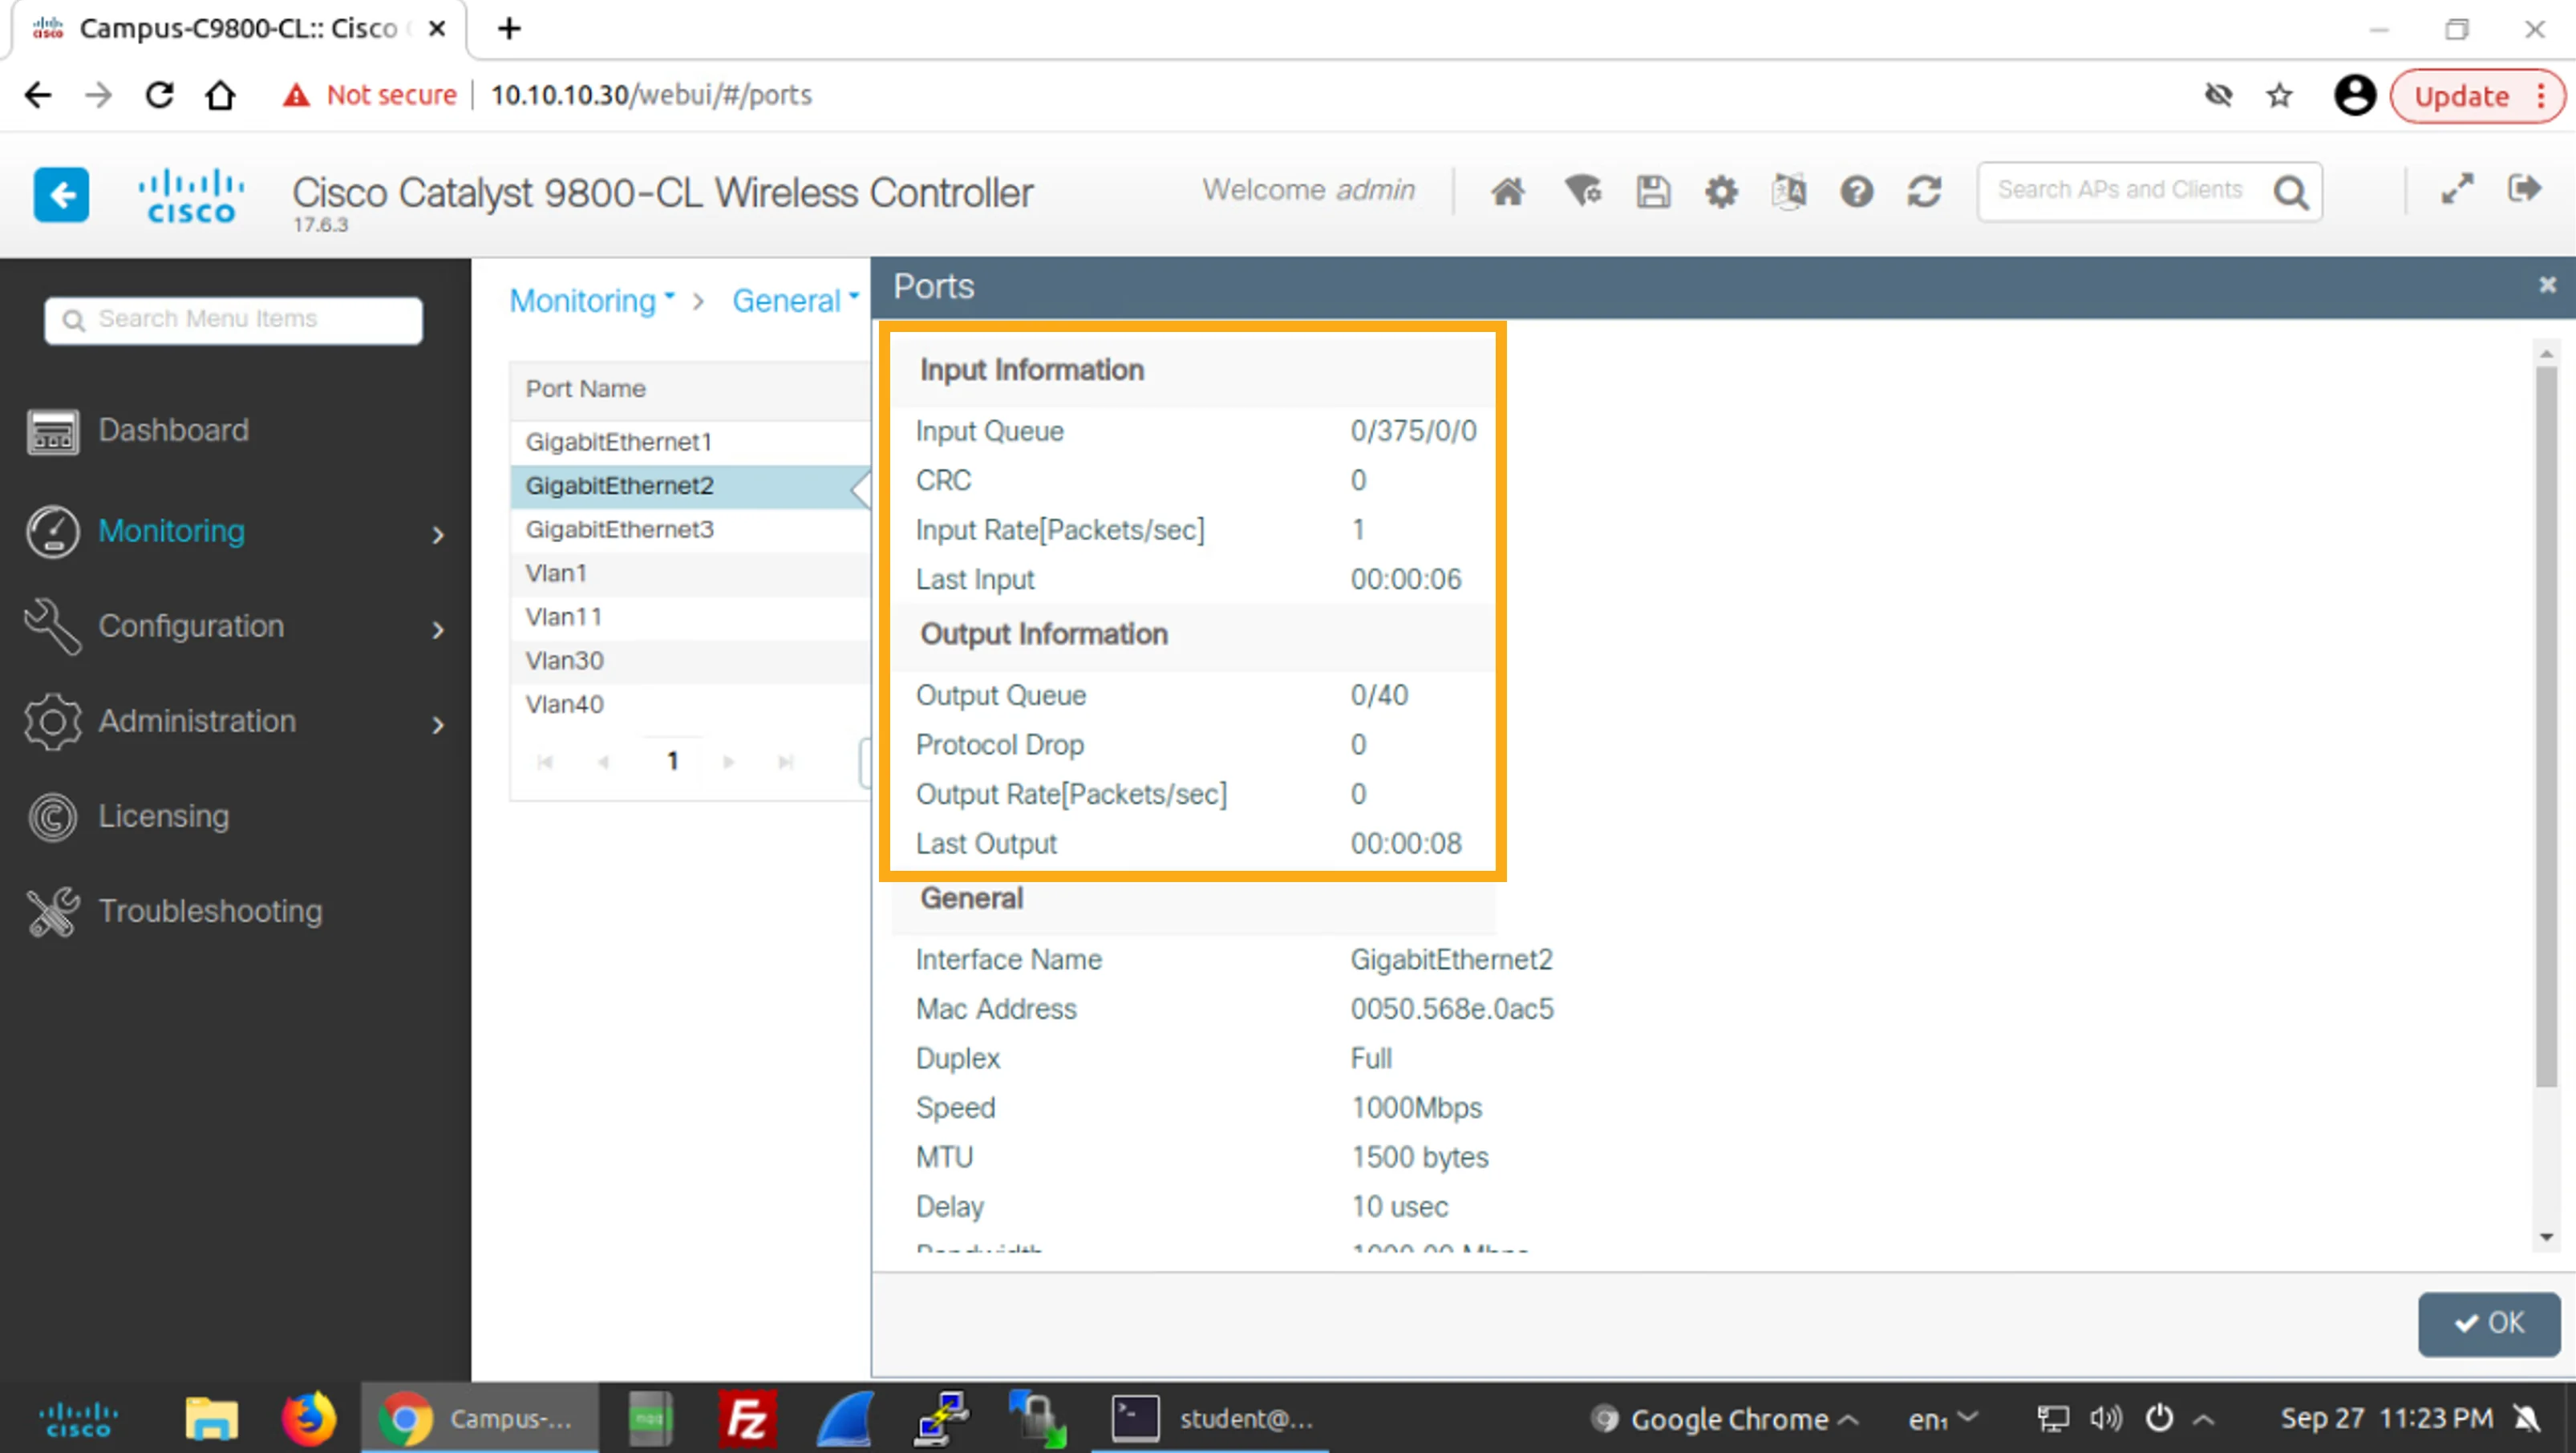
點按 GigabitEthernet2 連接埠,顯示輸入、輸出資訊以及該連接埠的一般設定。
Examine the provided port input and output information.
檢視所提供的連接埠輸入與輸出資訊。
The information includes the input and output rate in packets per second, the number of received packets that had CRC errors, and the time when the last packet was received or sent.
此資訊包括以每秒封包數計算的輸入與輸出速率、接收到的封包中發生 CRC 錯誤的數量,以及最後一次接收或傳送封包的時間。
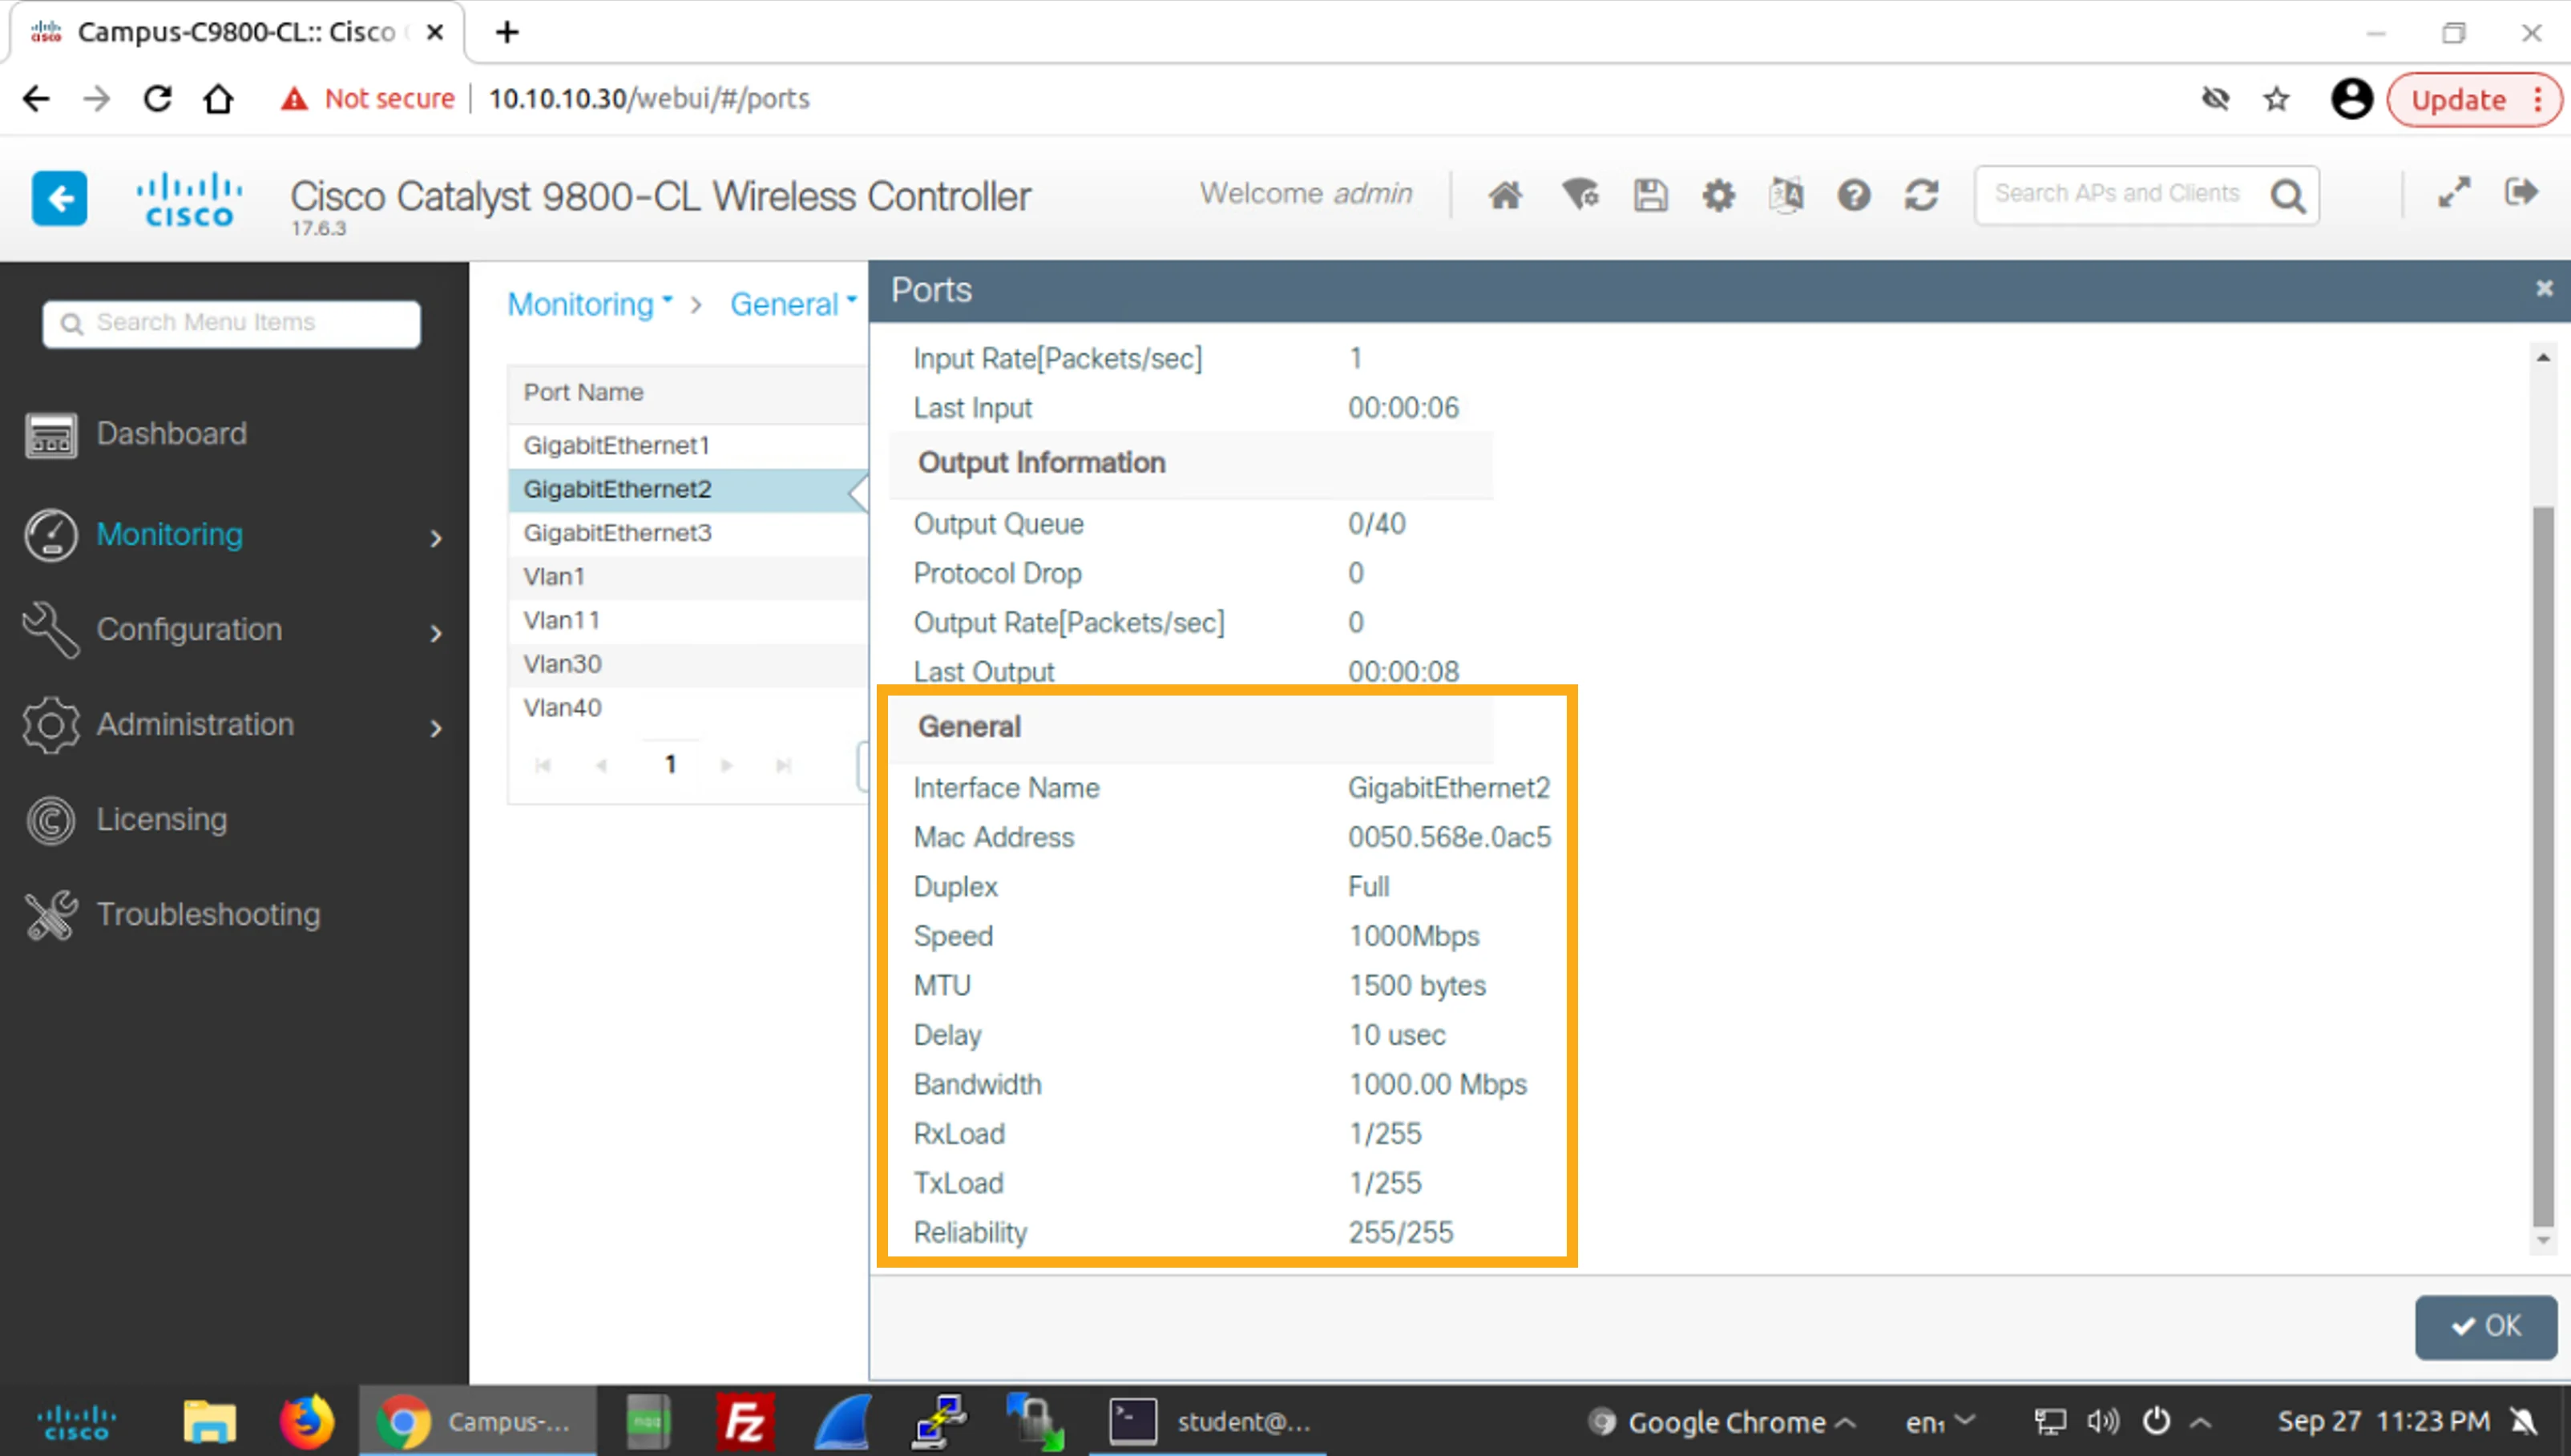
Click in the scroll bar area to move down the page to see the entire General port settings section and observe the provided information.
點按捲軸區域向下移動頁面,檢視完整的 General 連接埠設定區段,並觀察所提供的資訊。
The general port settings include Interface Name, MAC Address, Duplex, Speed, and MTU configuration and traffic-related values: Delay, Bandwidth, Load, and Reliability.
一般連接埠設定包括 Interface Name、MAC Address、Duplex、Speed 與 MTU 設定,以及與流量相關的數值:Delay、Bandwidth、Load 與 Reliability。
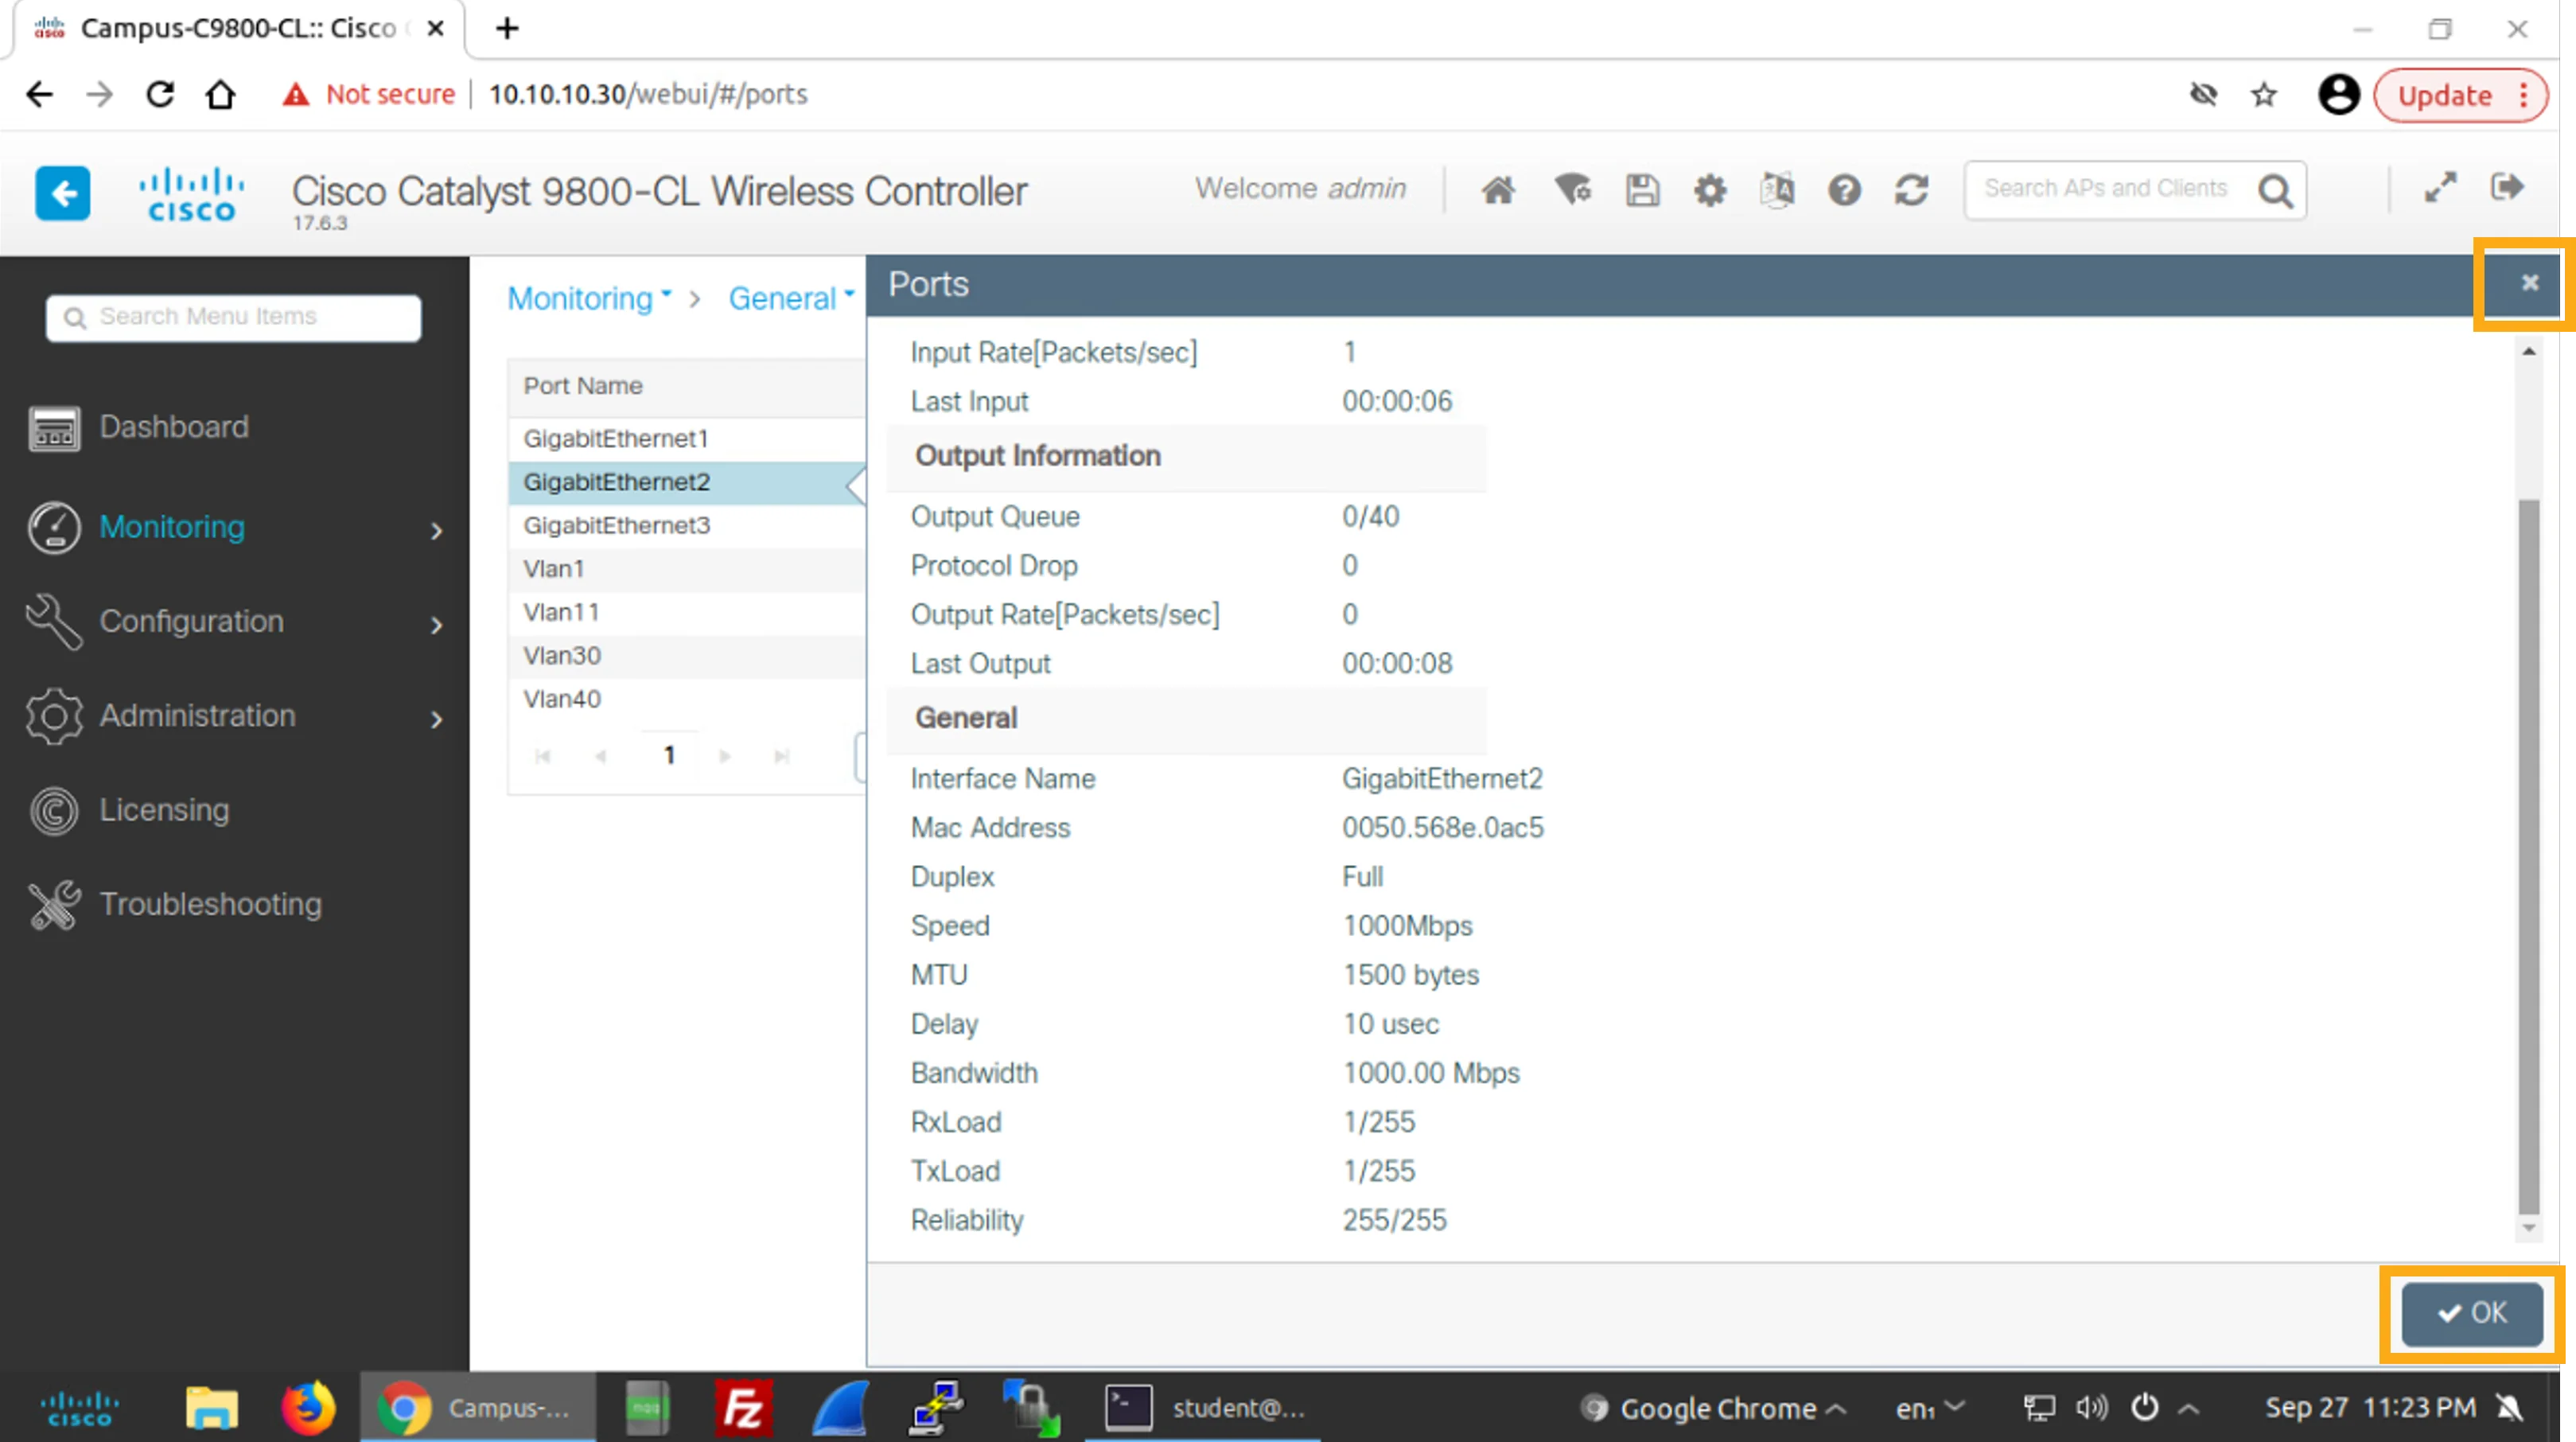
Click OK at the bottom right or the X at the top-right corner of the Ports window to close the window that shows details about the chosen port.
點按右下角的 OK,或點按 Ports 視窗右上角的 X,關閉顯示所選連接埠詳細資料的視窗。
Choose Monitoring > Wireless > AP Statistics to open the AP Statistics page.
選擇 Monitoring > Wireless > AP Statistics,開啟 AP Statistics 頁面。
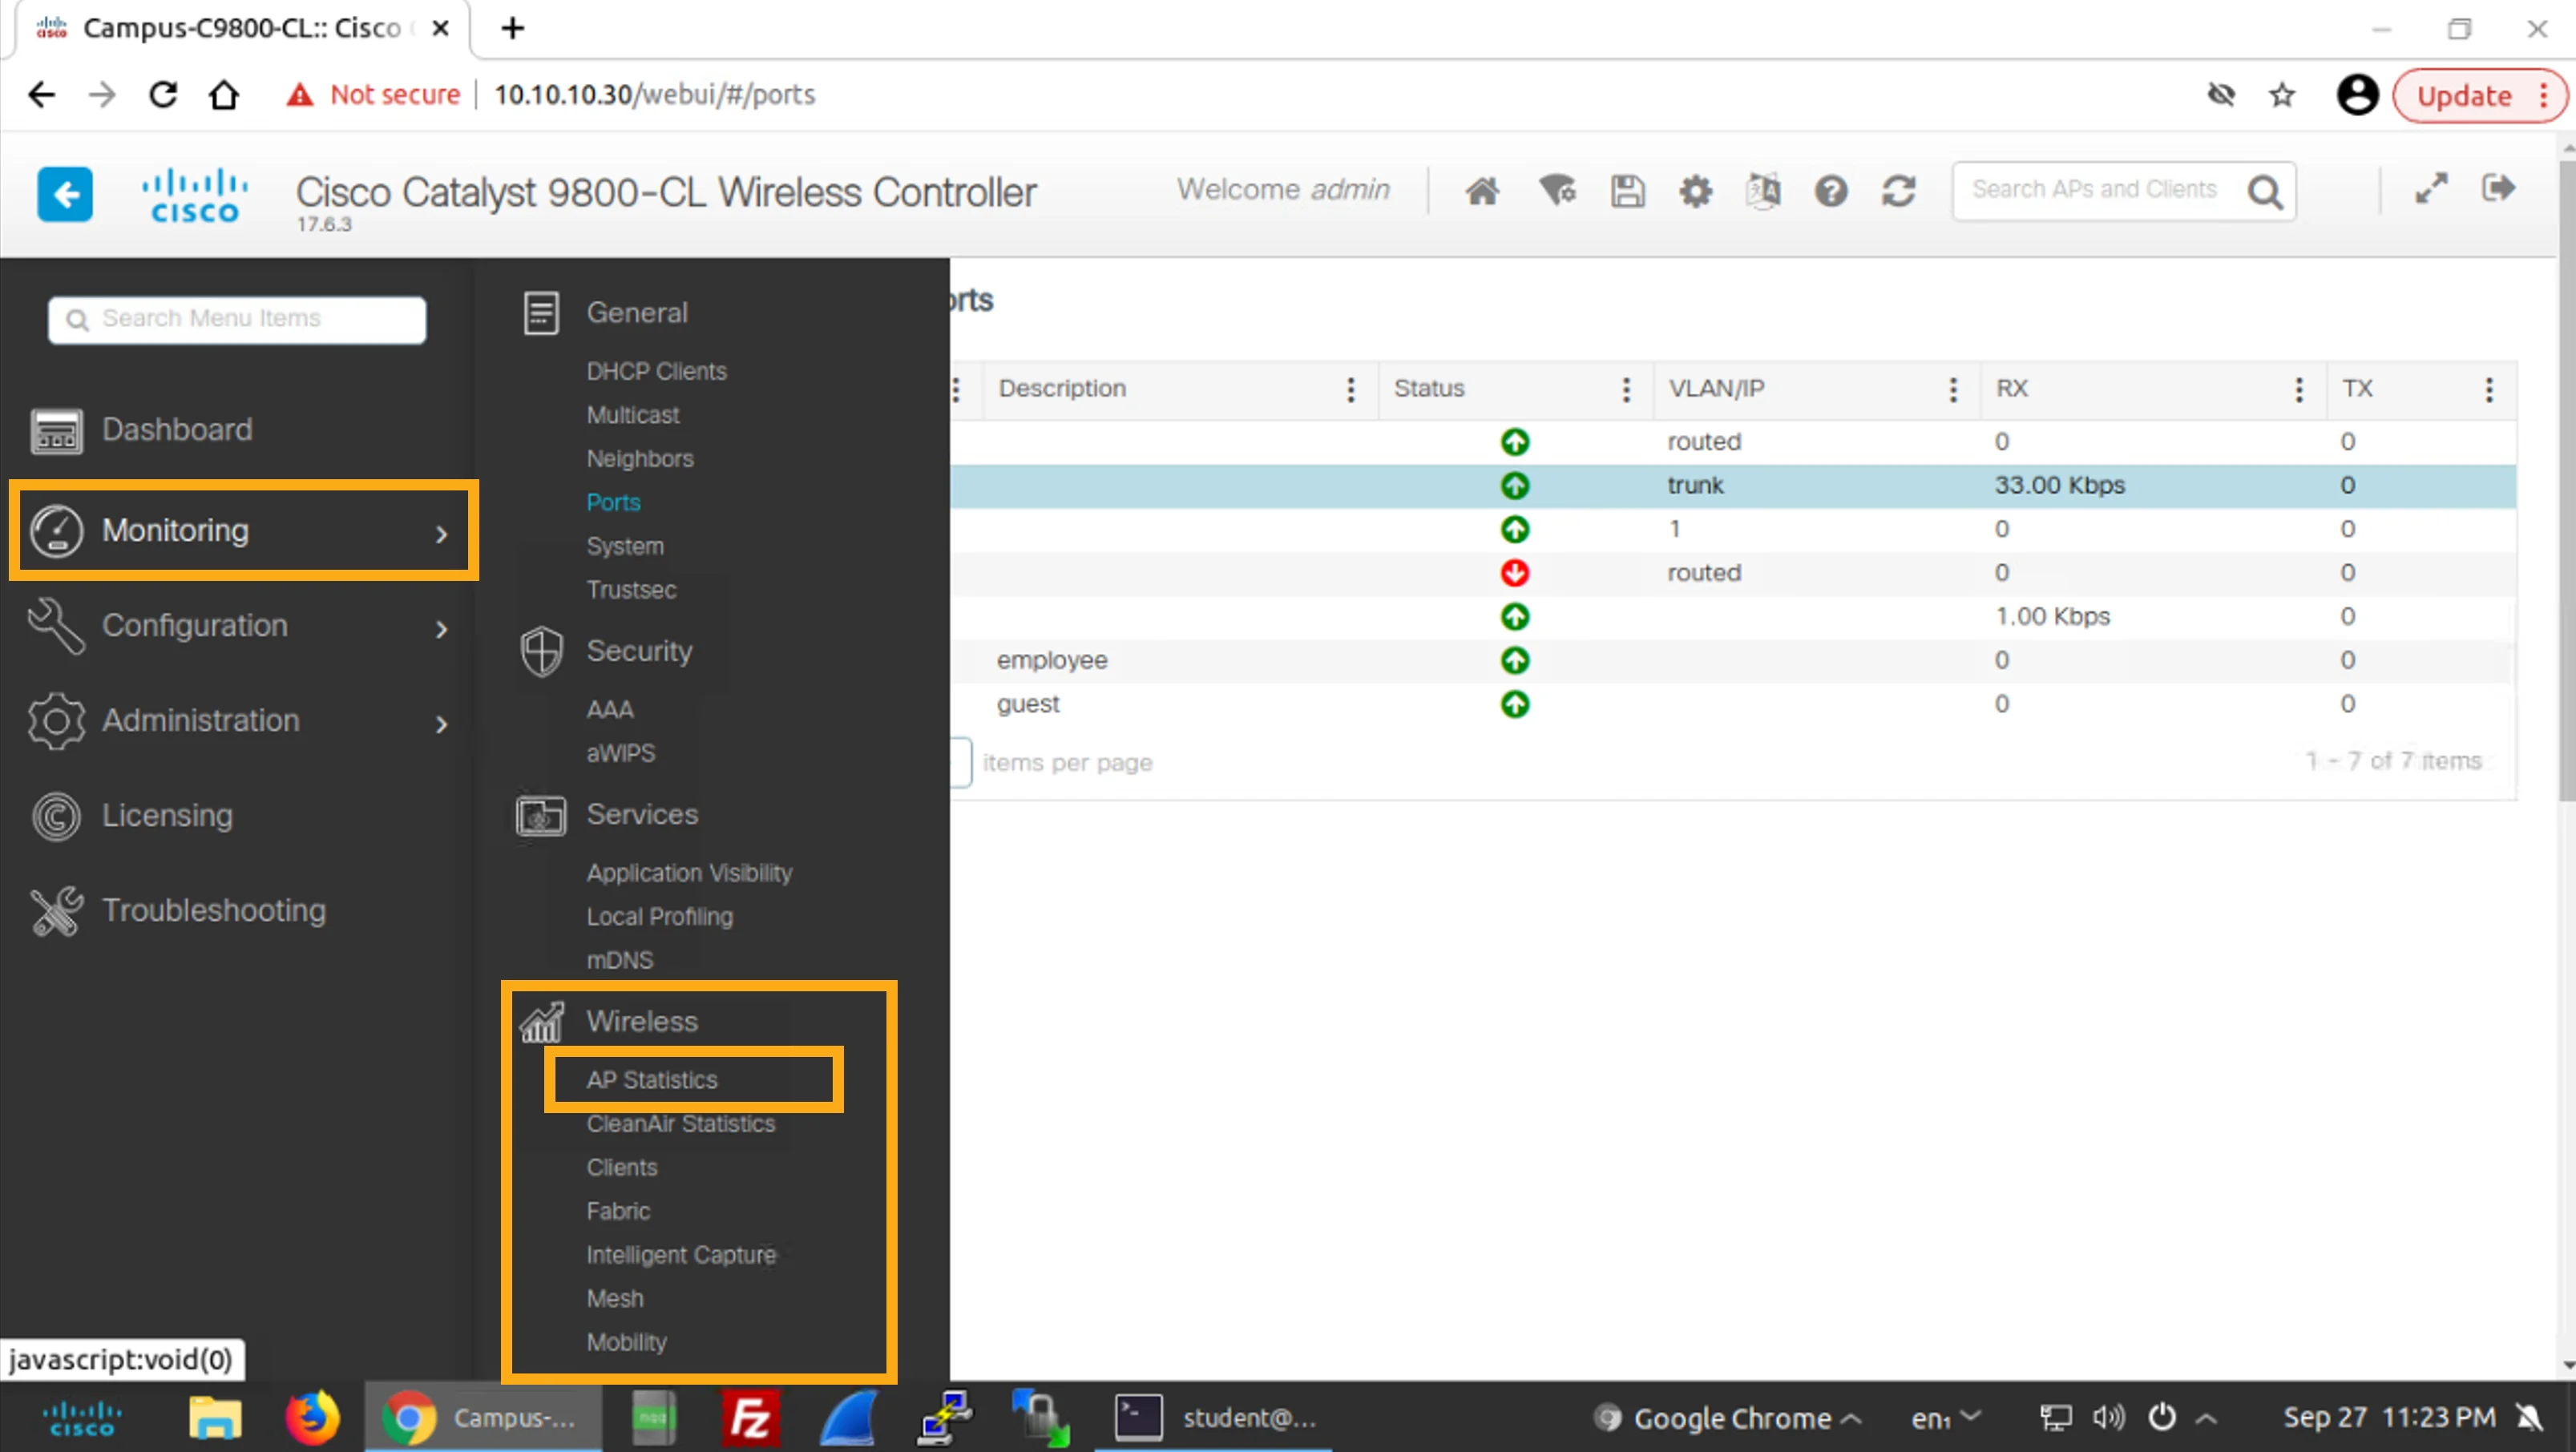
On the AP Statistics page, examine the list of APs and the information that is provided for each one.
在 AP Statistics 頁面上,檢視 AP 清單以及每個 AP 所提供的資訊。
The AP information includes the name, the model, the administrative, operational, and configuration status, and the IP and MAC addresses.
AP 資訊包括名稱、機型、管理狀態、運作狀態與設定狀態,以及 IP 與 MAC 位址。
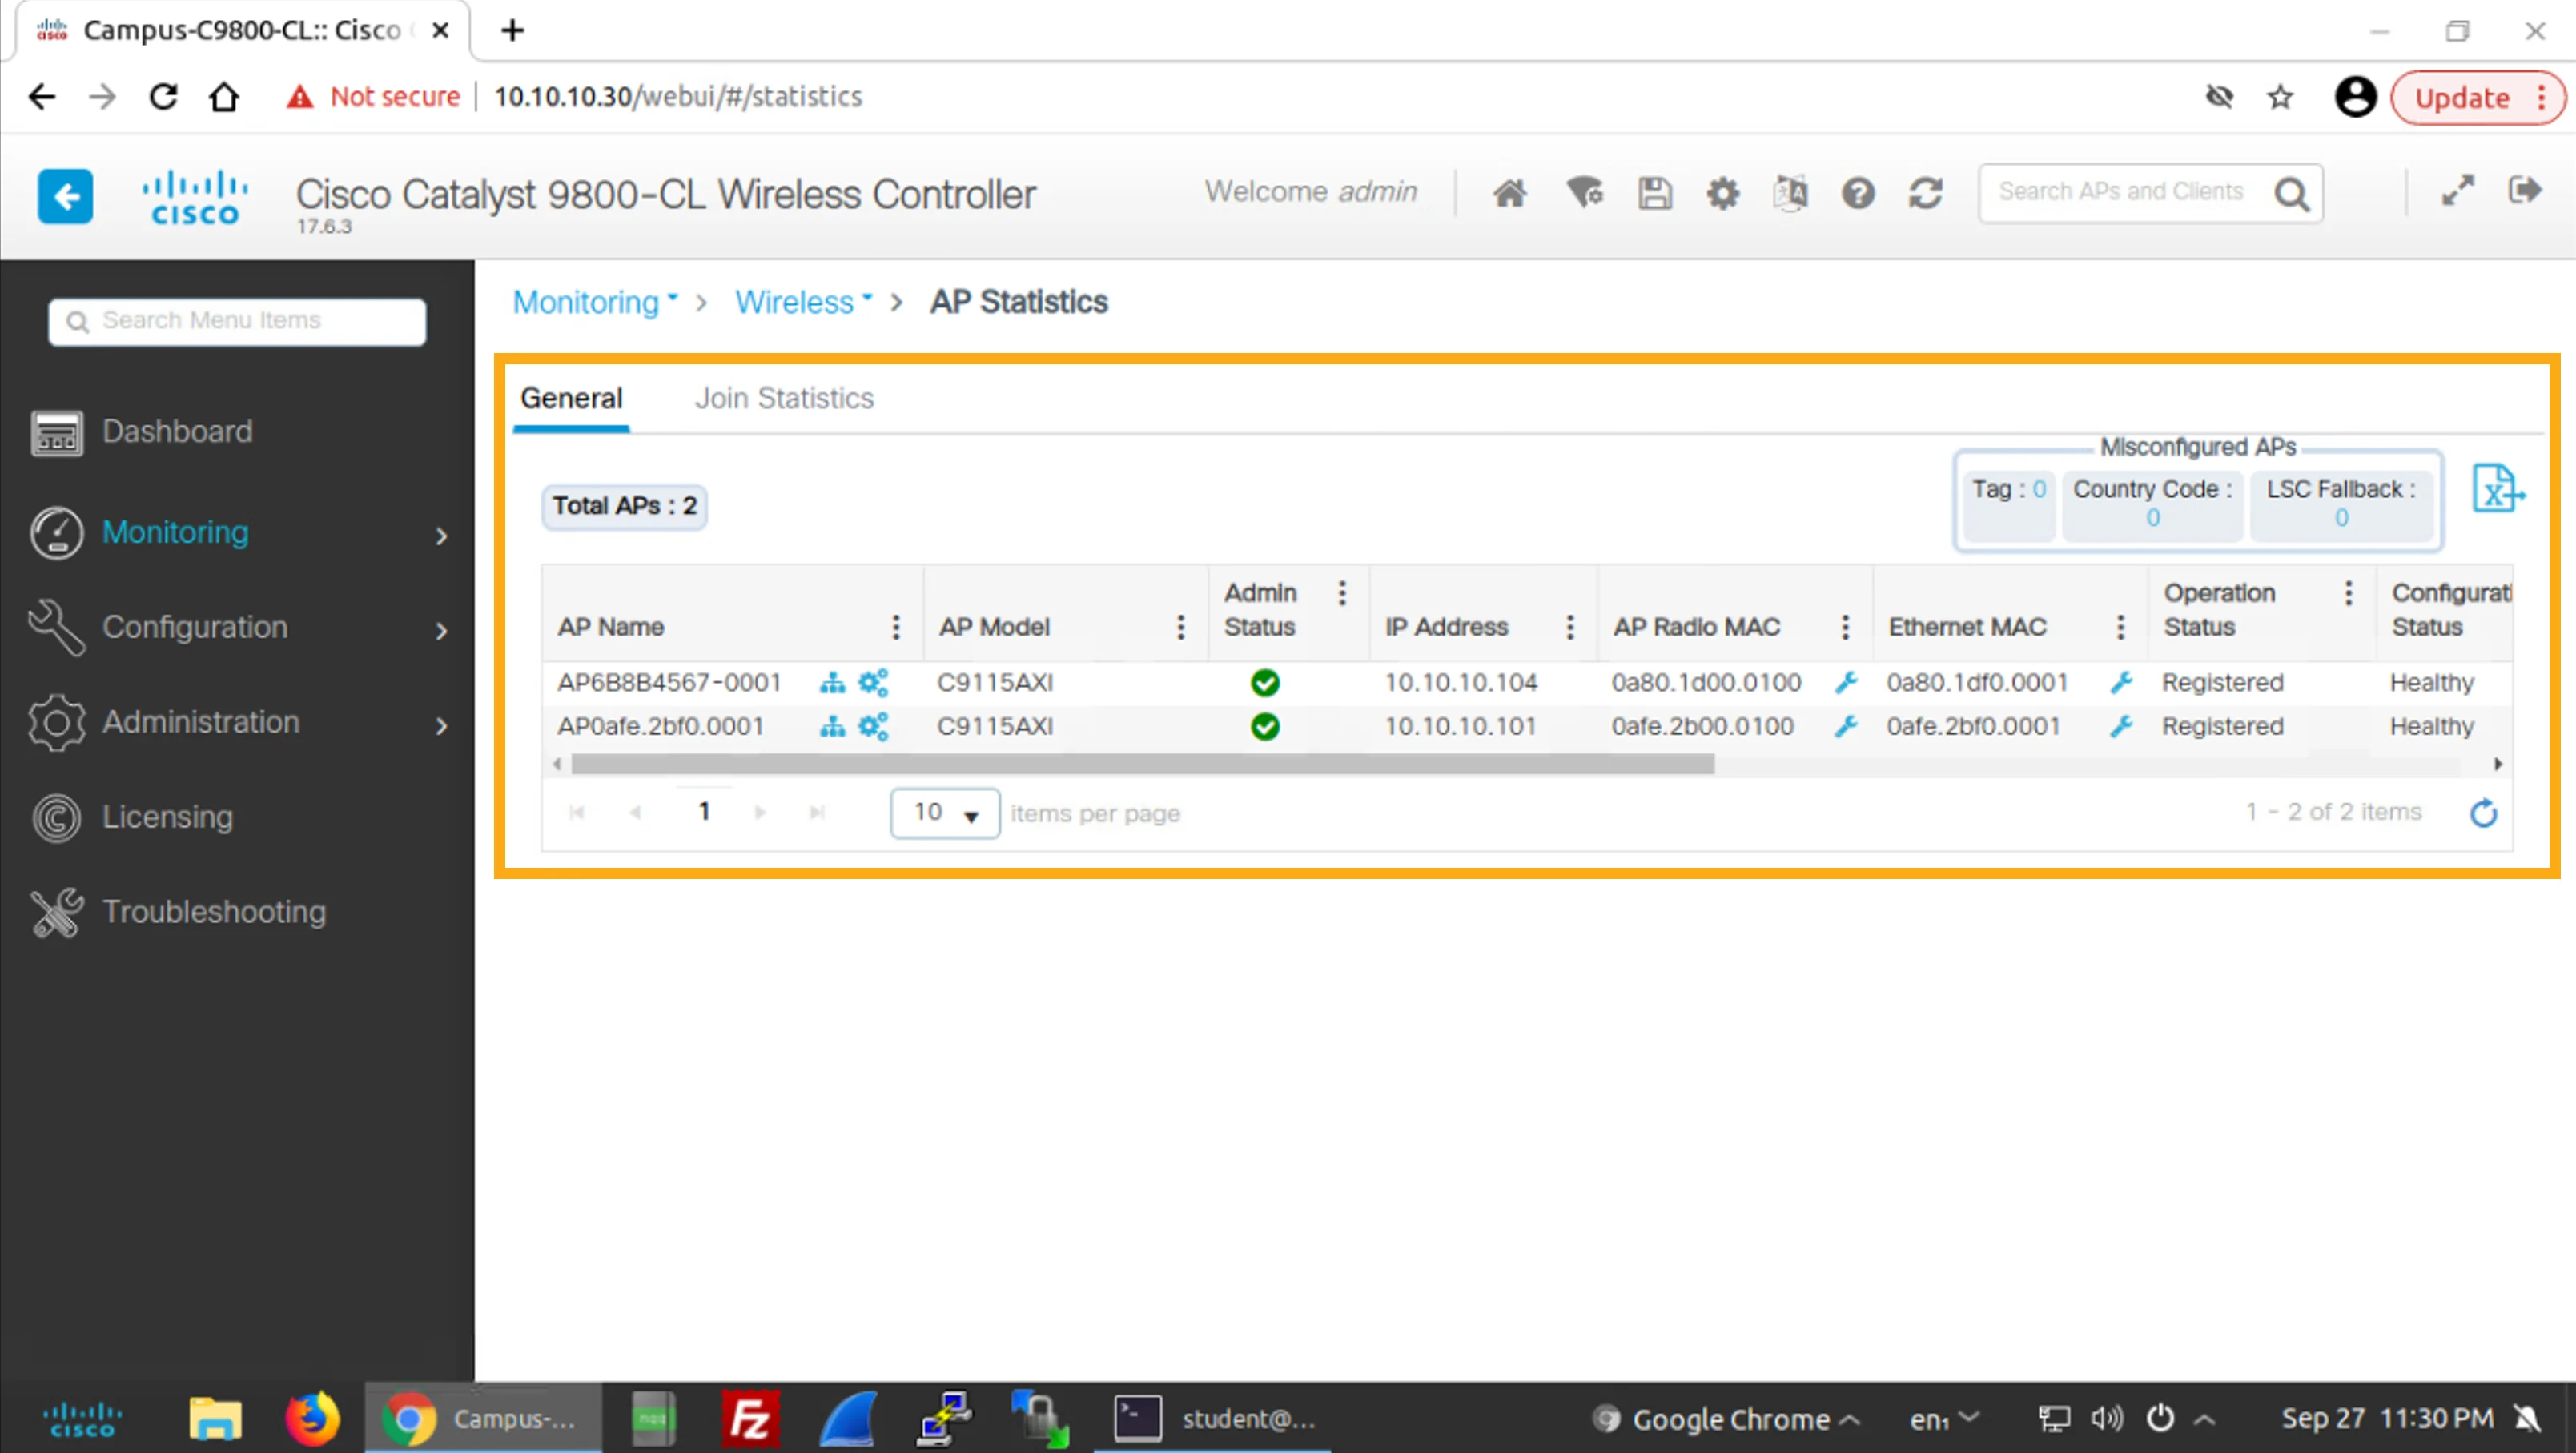
Click the first AP in the list (AP6B8B4567-0001) to display even more details about the access point.
點按清單中的第一個 AP(AP6B8B4567-0001),顯示該無線基地台更多的詳細資料。
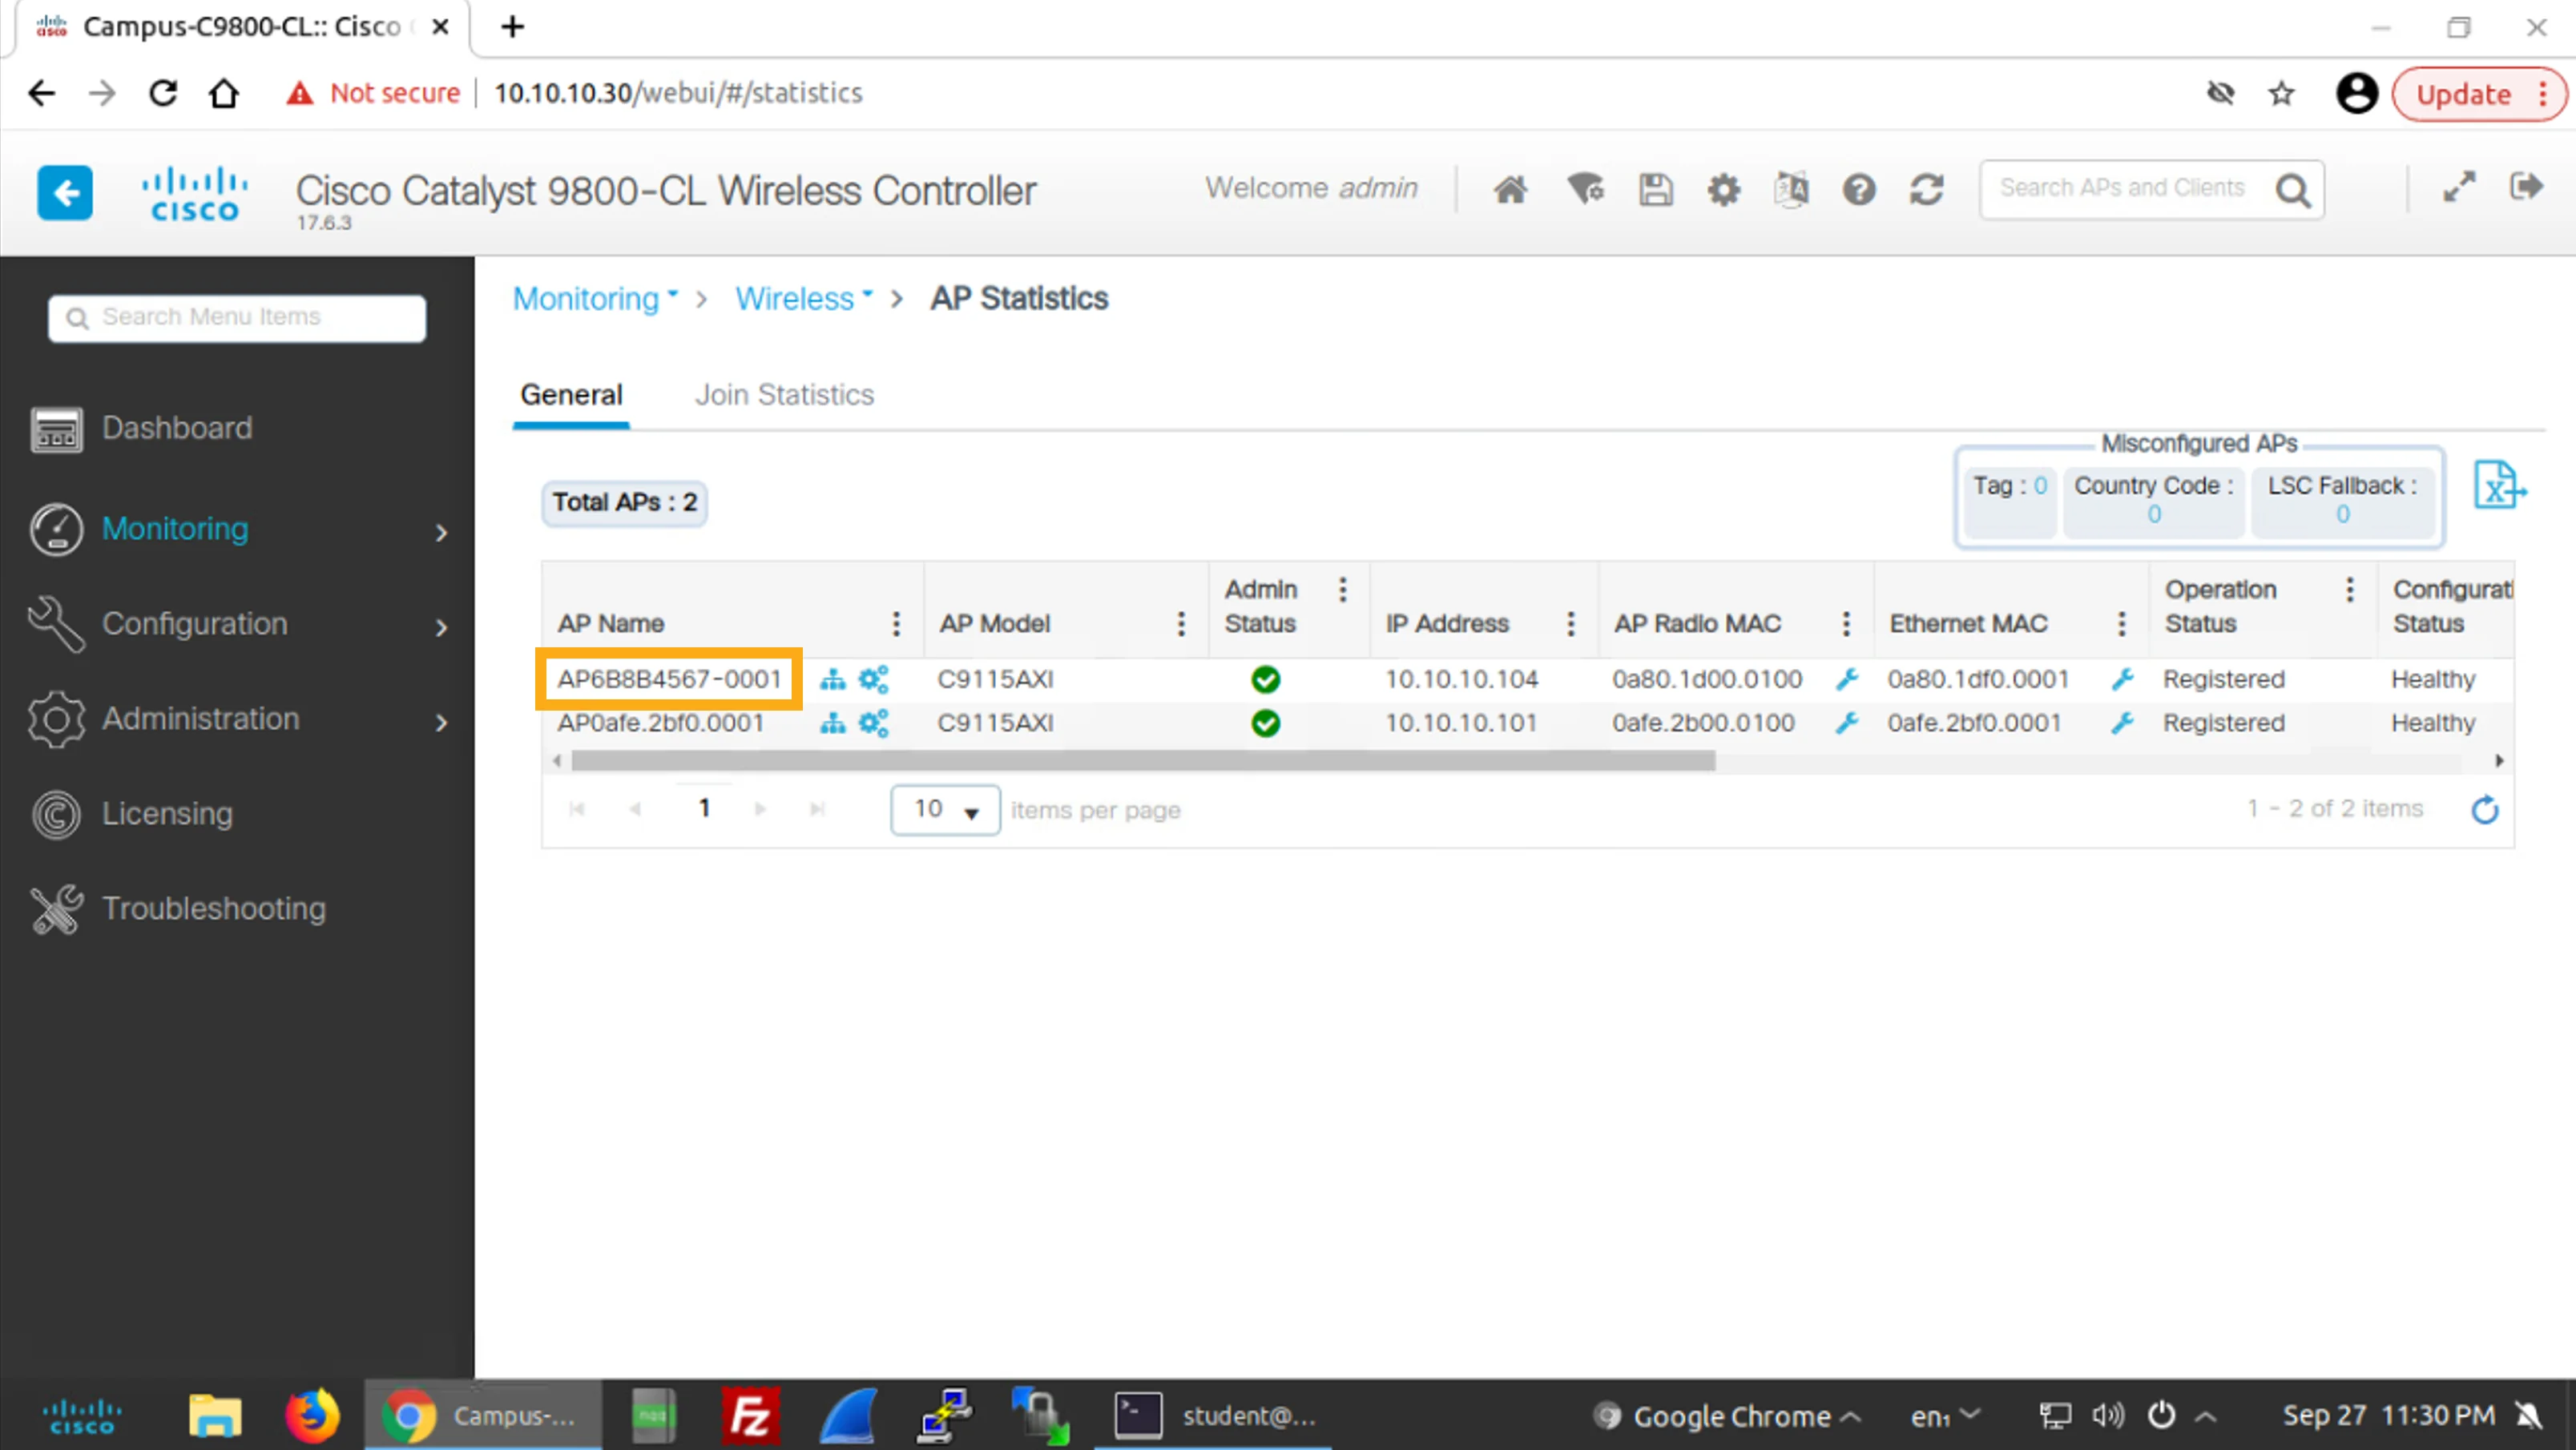
Examine the information that is provided in the 360 View of the chosen AP.
檢視所選 AP 的 360 View 中提供的資訊。
The upper part of the 360 View includes the location of the AP, its serial number, power status, software and boot version, up time, and the date and time when the AP joined the WLC.
360 View 的上半部包括 AP 的所在位置、序號、電源狀態、軟體與開機版本、運作時間,以及該 AP 加入 WLC 的日期與時間。
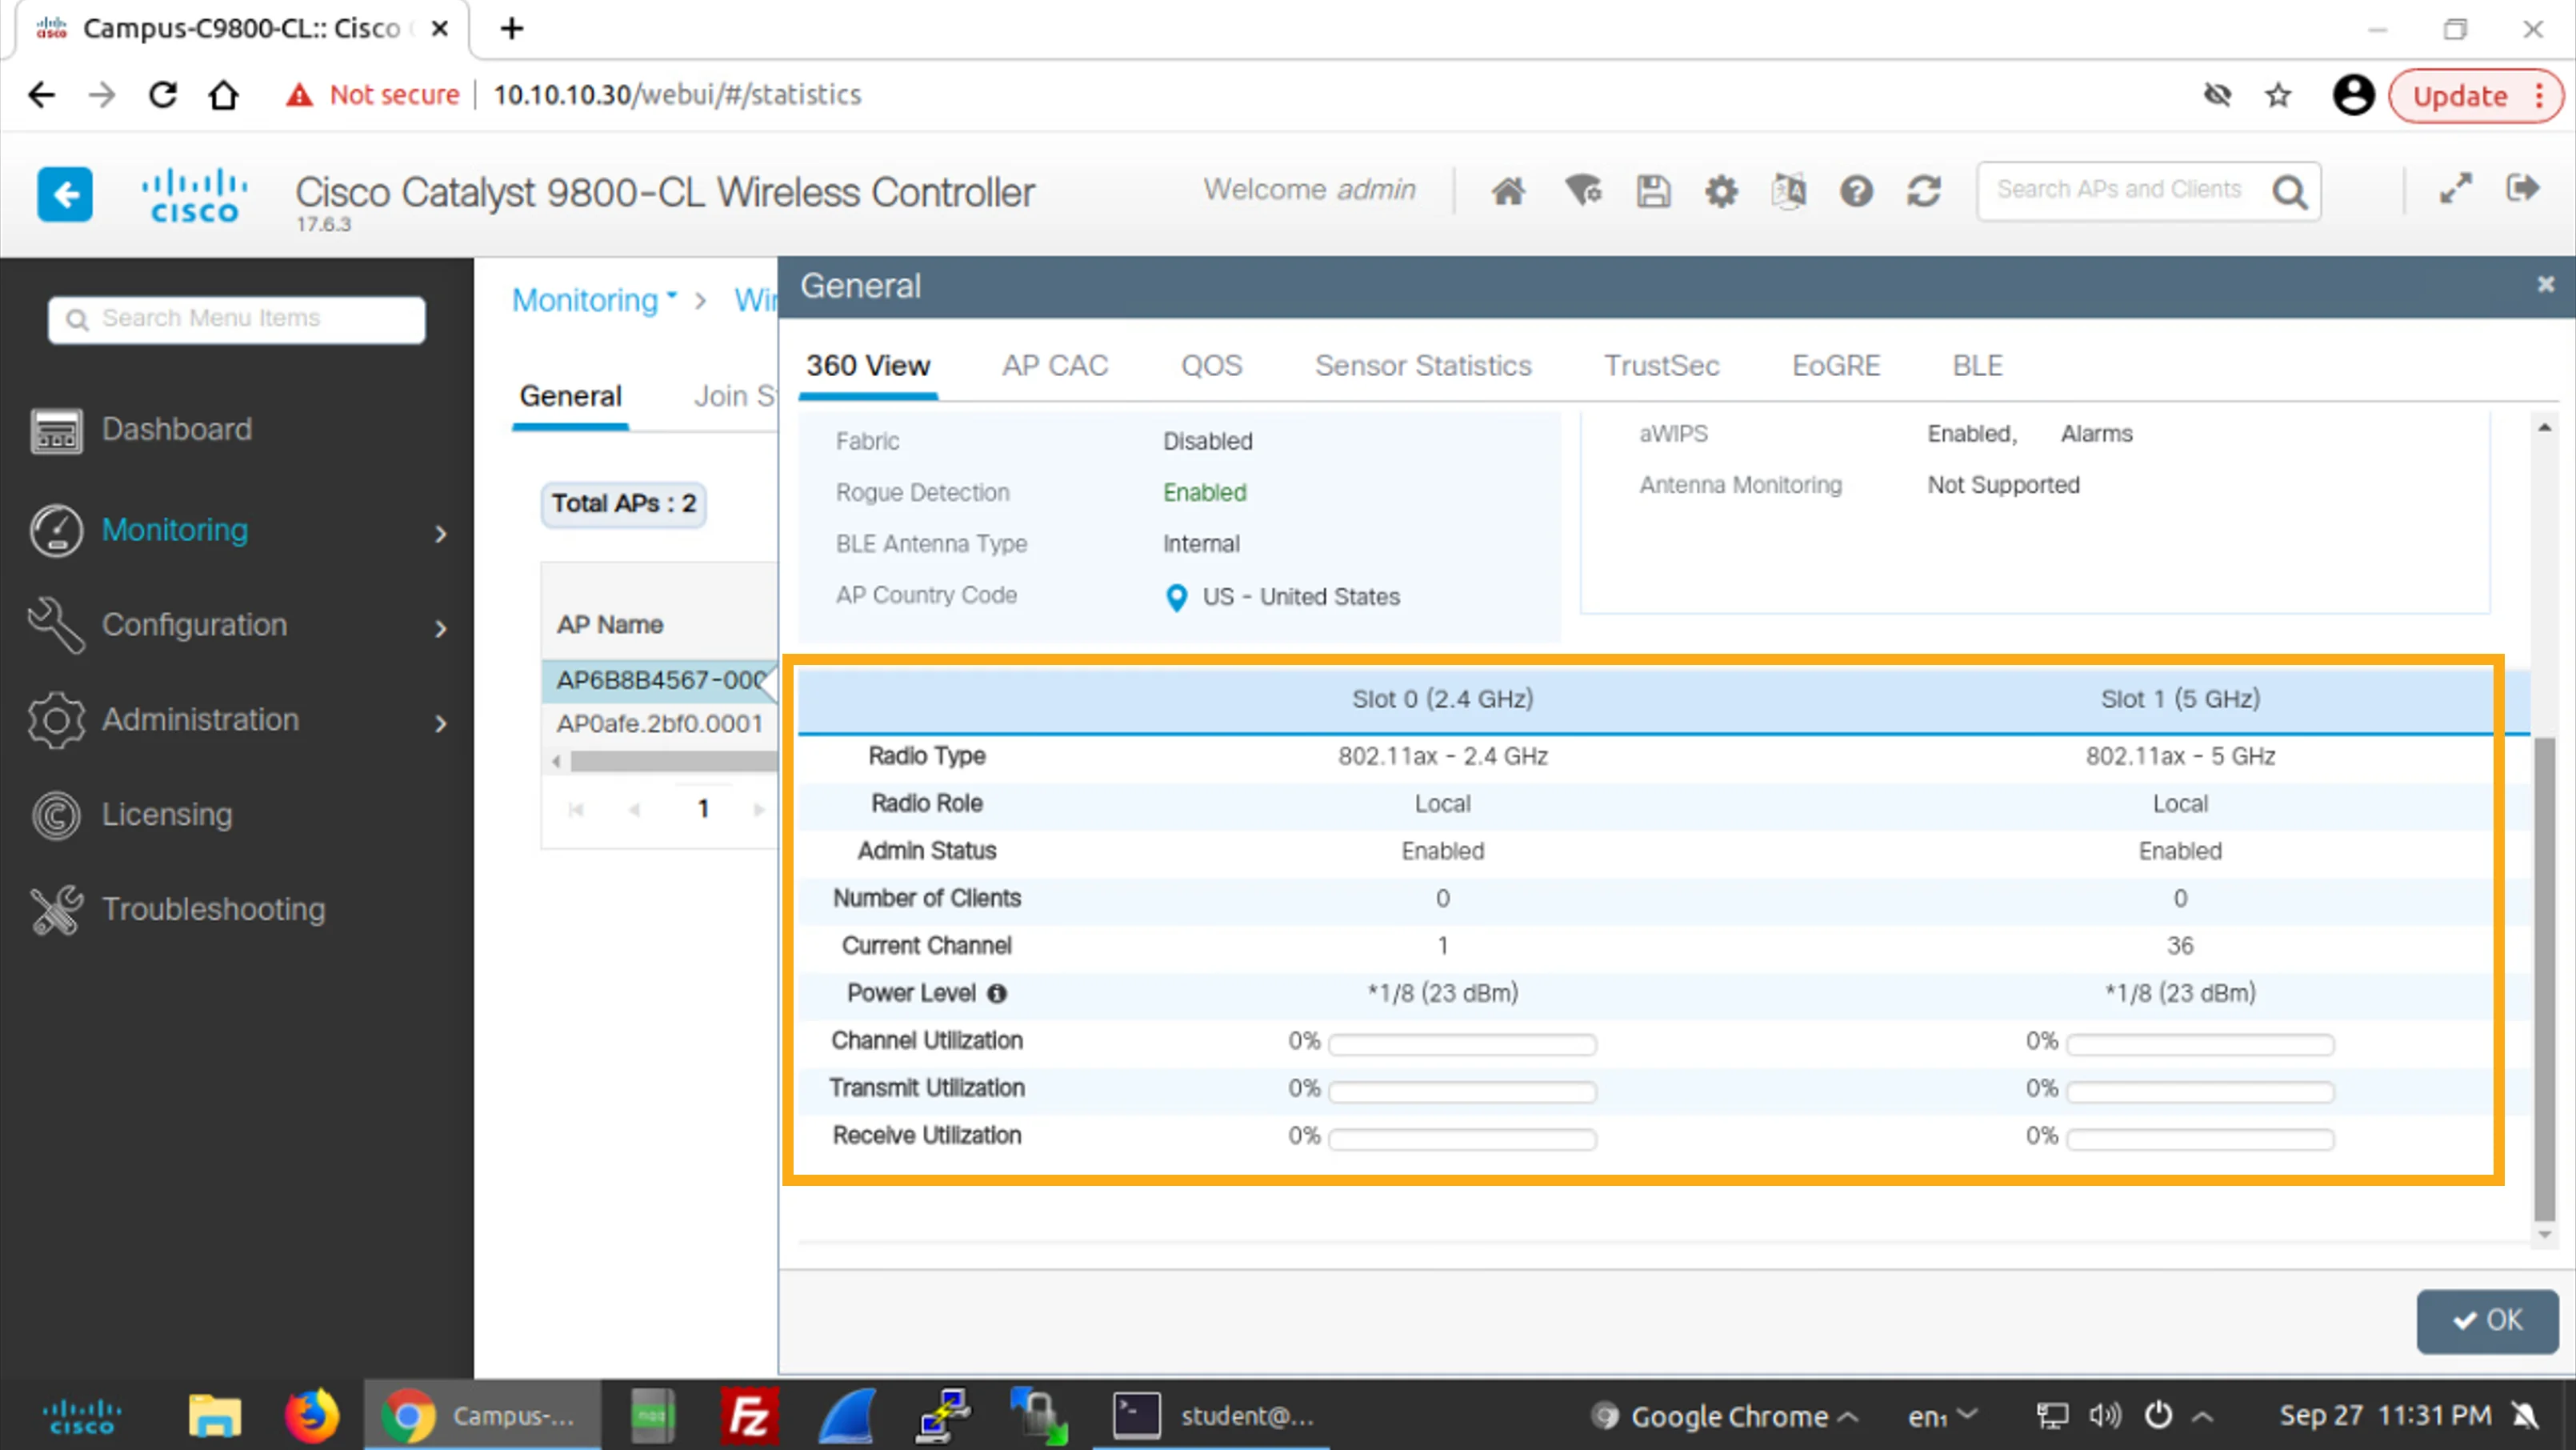
After you scroll down, you can see radio-related information about the AP, which is shown separately for the 2.4-GHz and the 5-GHz band.
向下捲動後,你可以看到與無線電相關的資訊,分別針對 2.4 GHz 與 5 GHz 頻帶顯示。
The following information is provided in the upper part of the 360 View.
360 View 上半部所提供的資訊如下。
The following radio-related information is shown in the 360 View.
360 View 中顯示的無線電相關資訊如下。
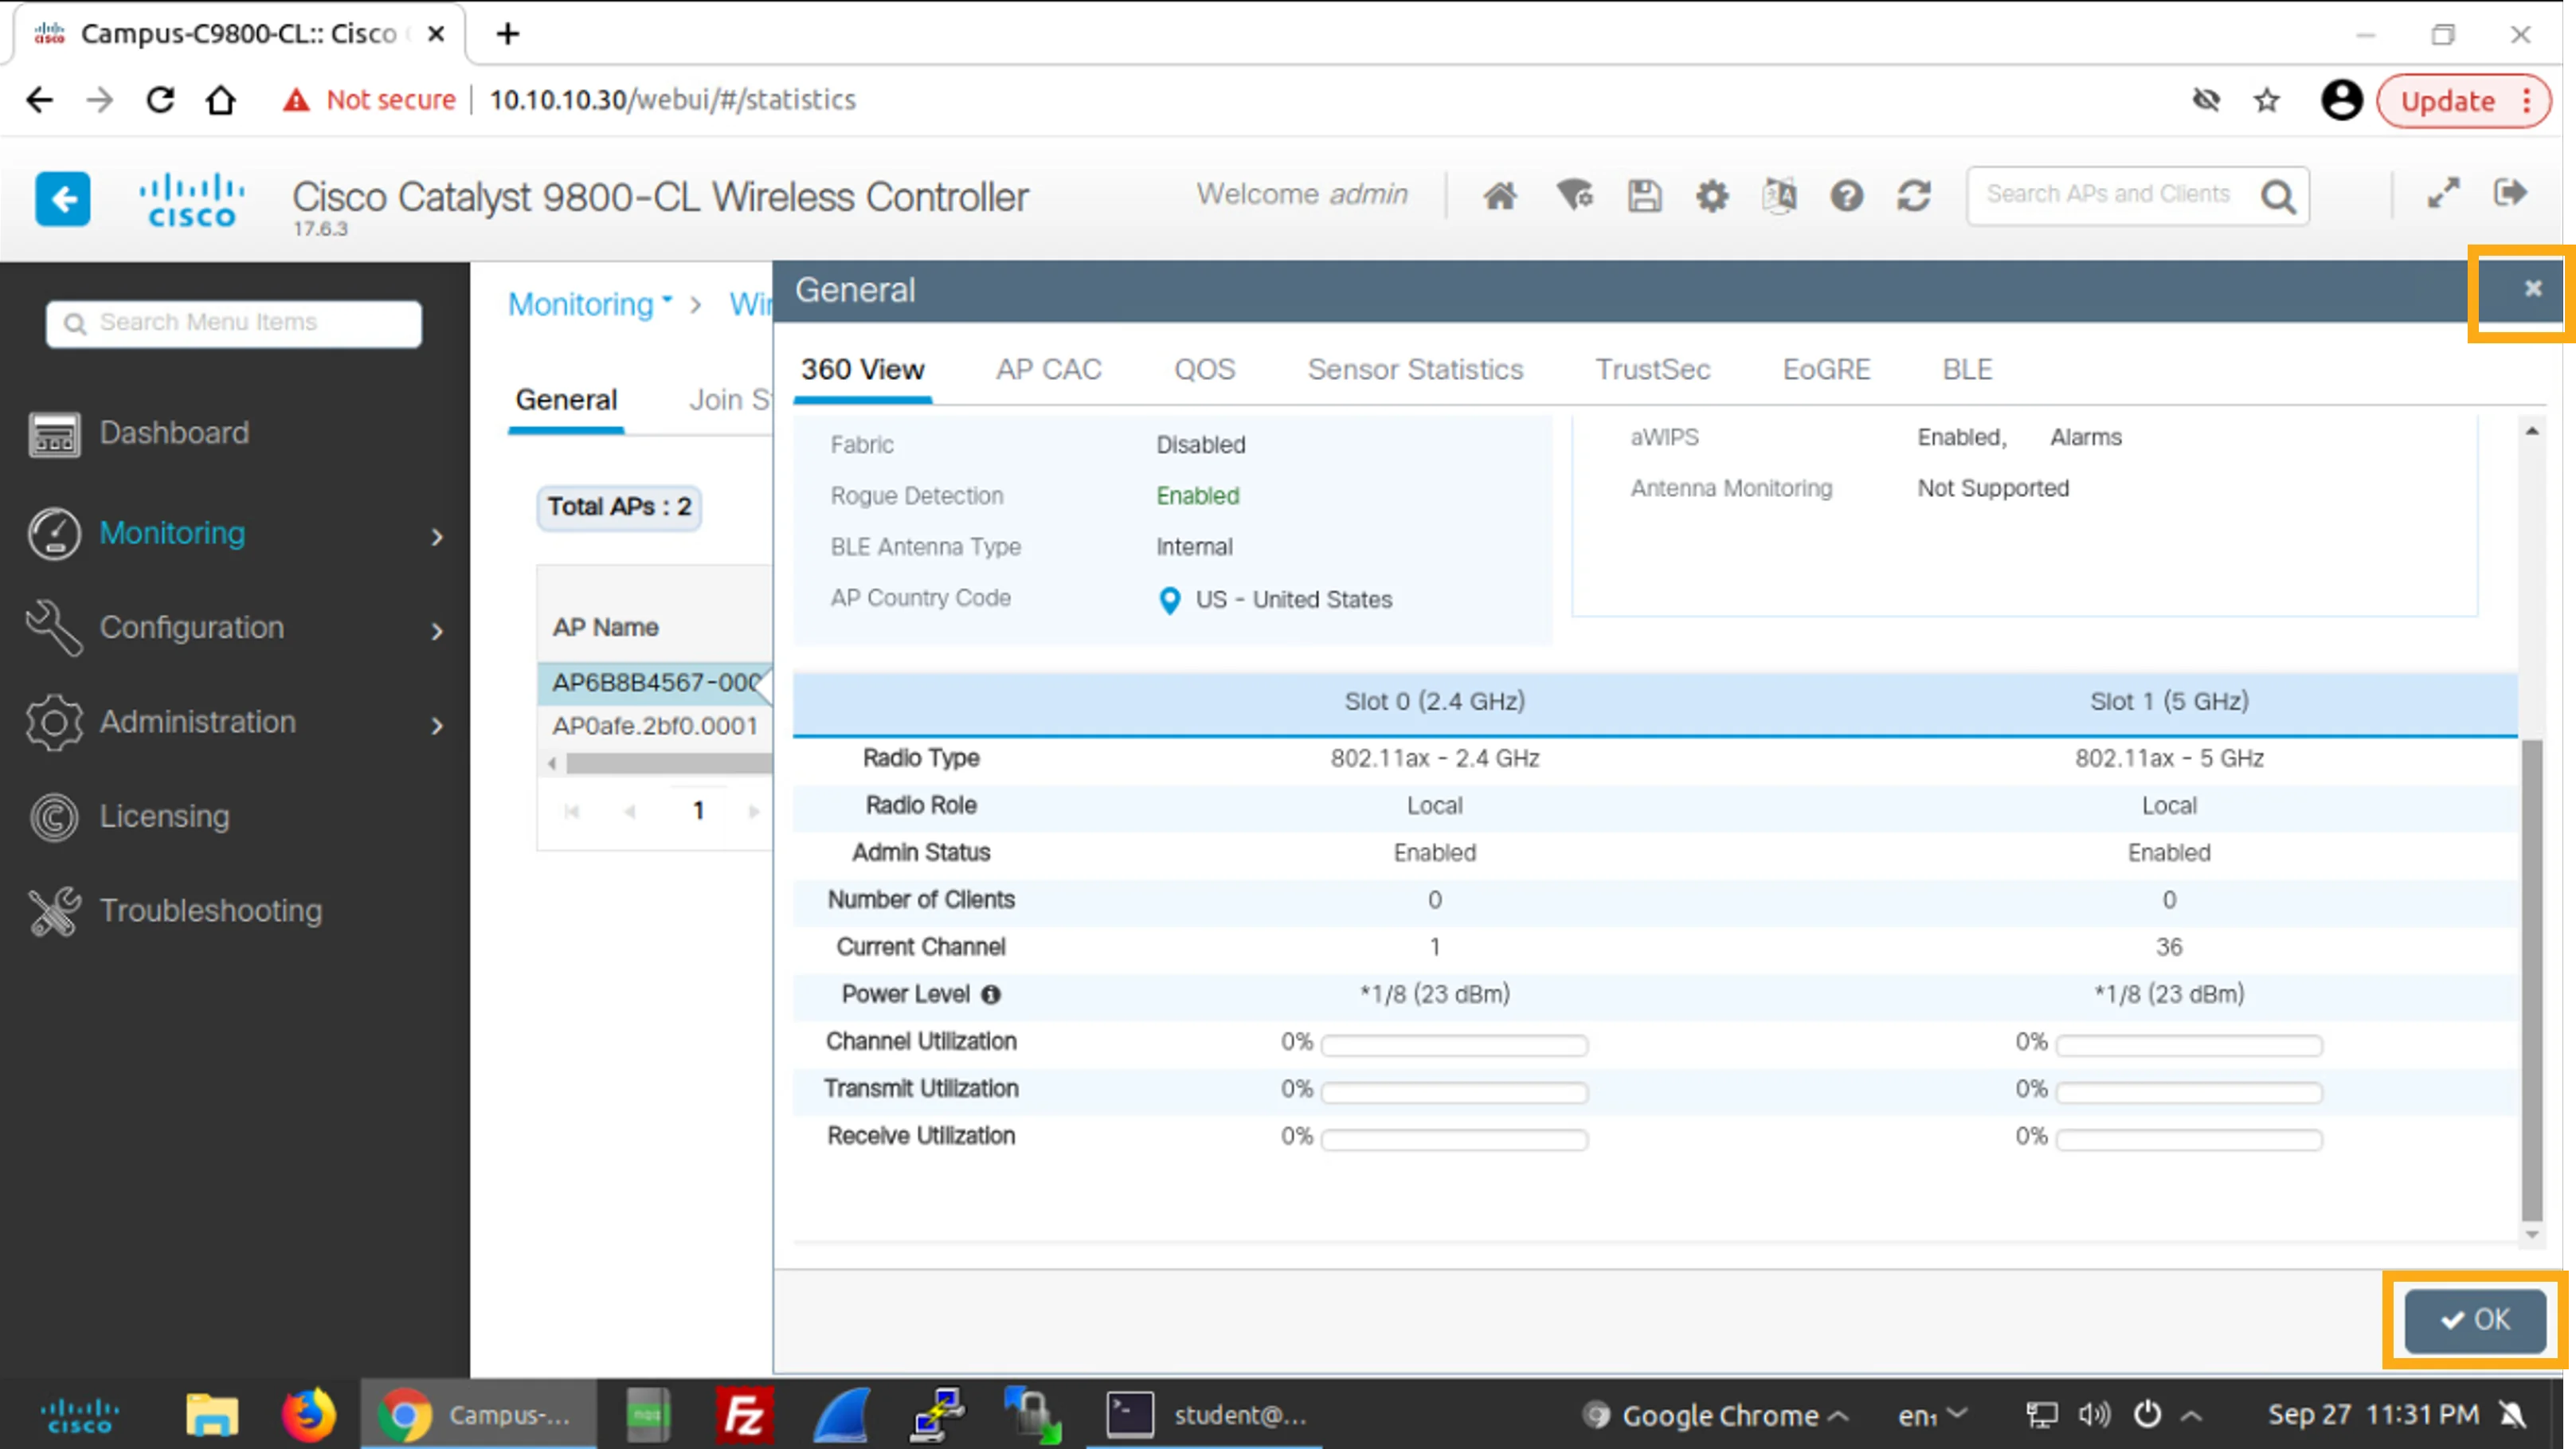
Click OK at the bottom right or the X at the top-right corner of the window that shows the 360 View of the AP to close the window.
點按右下角的 OK,或點按顯示該 AP 360 View 視窗右上角的 X,關閉視窗。
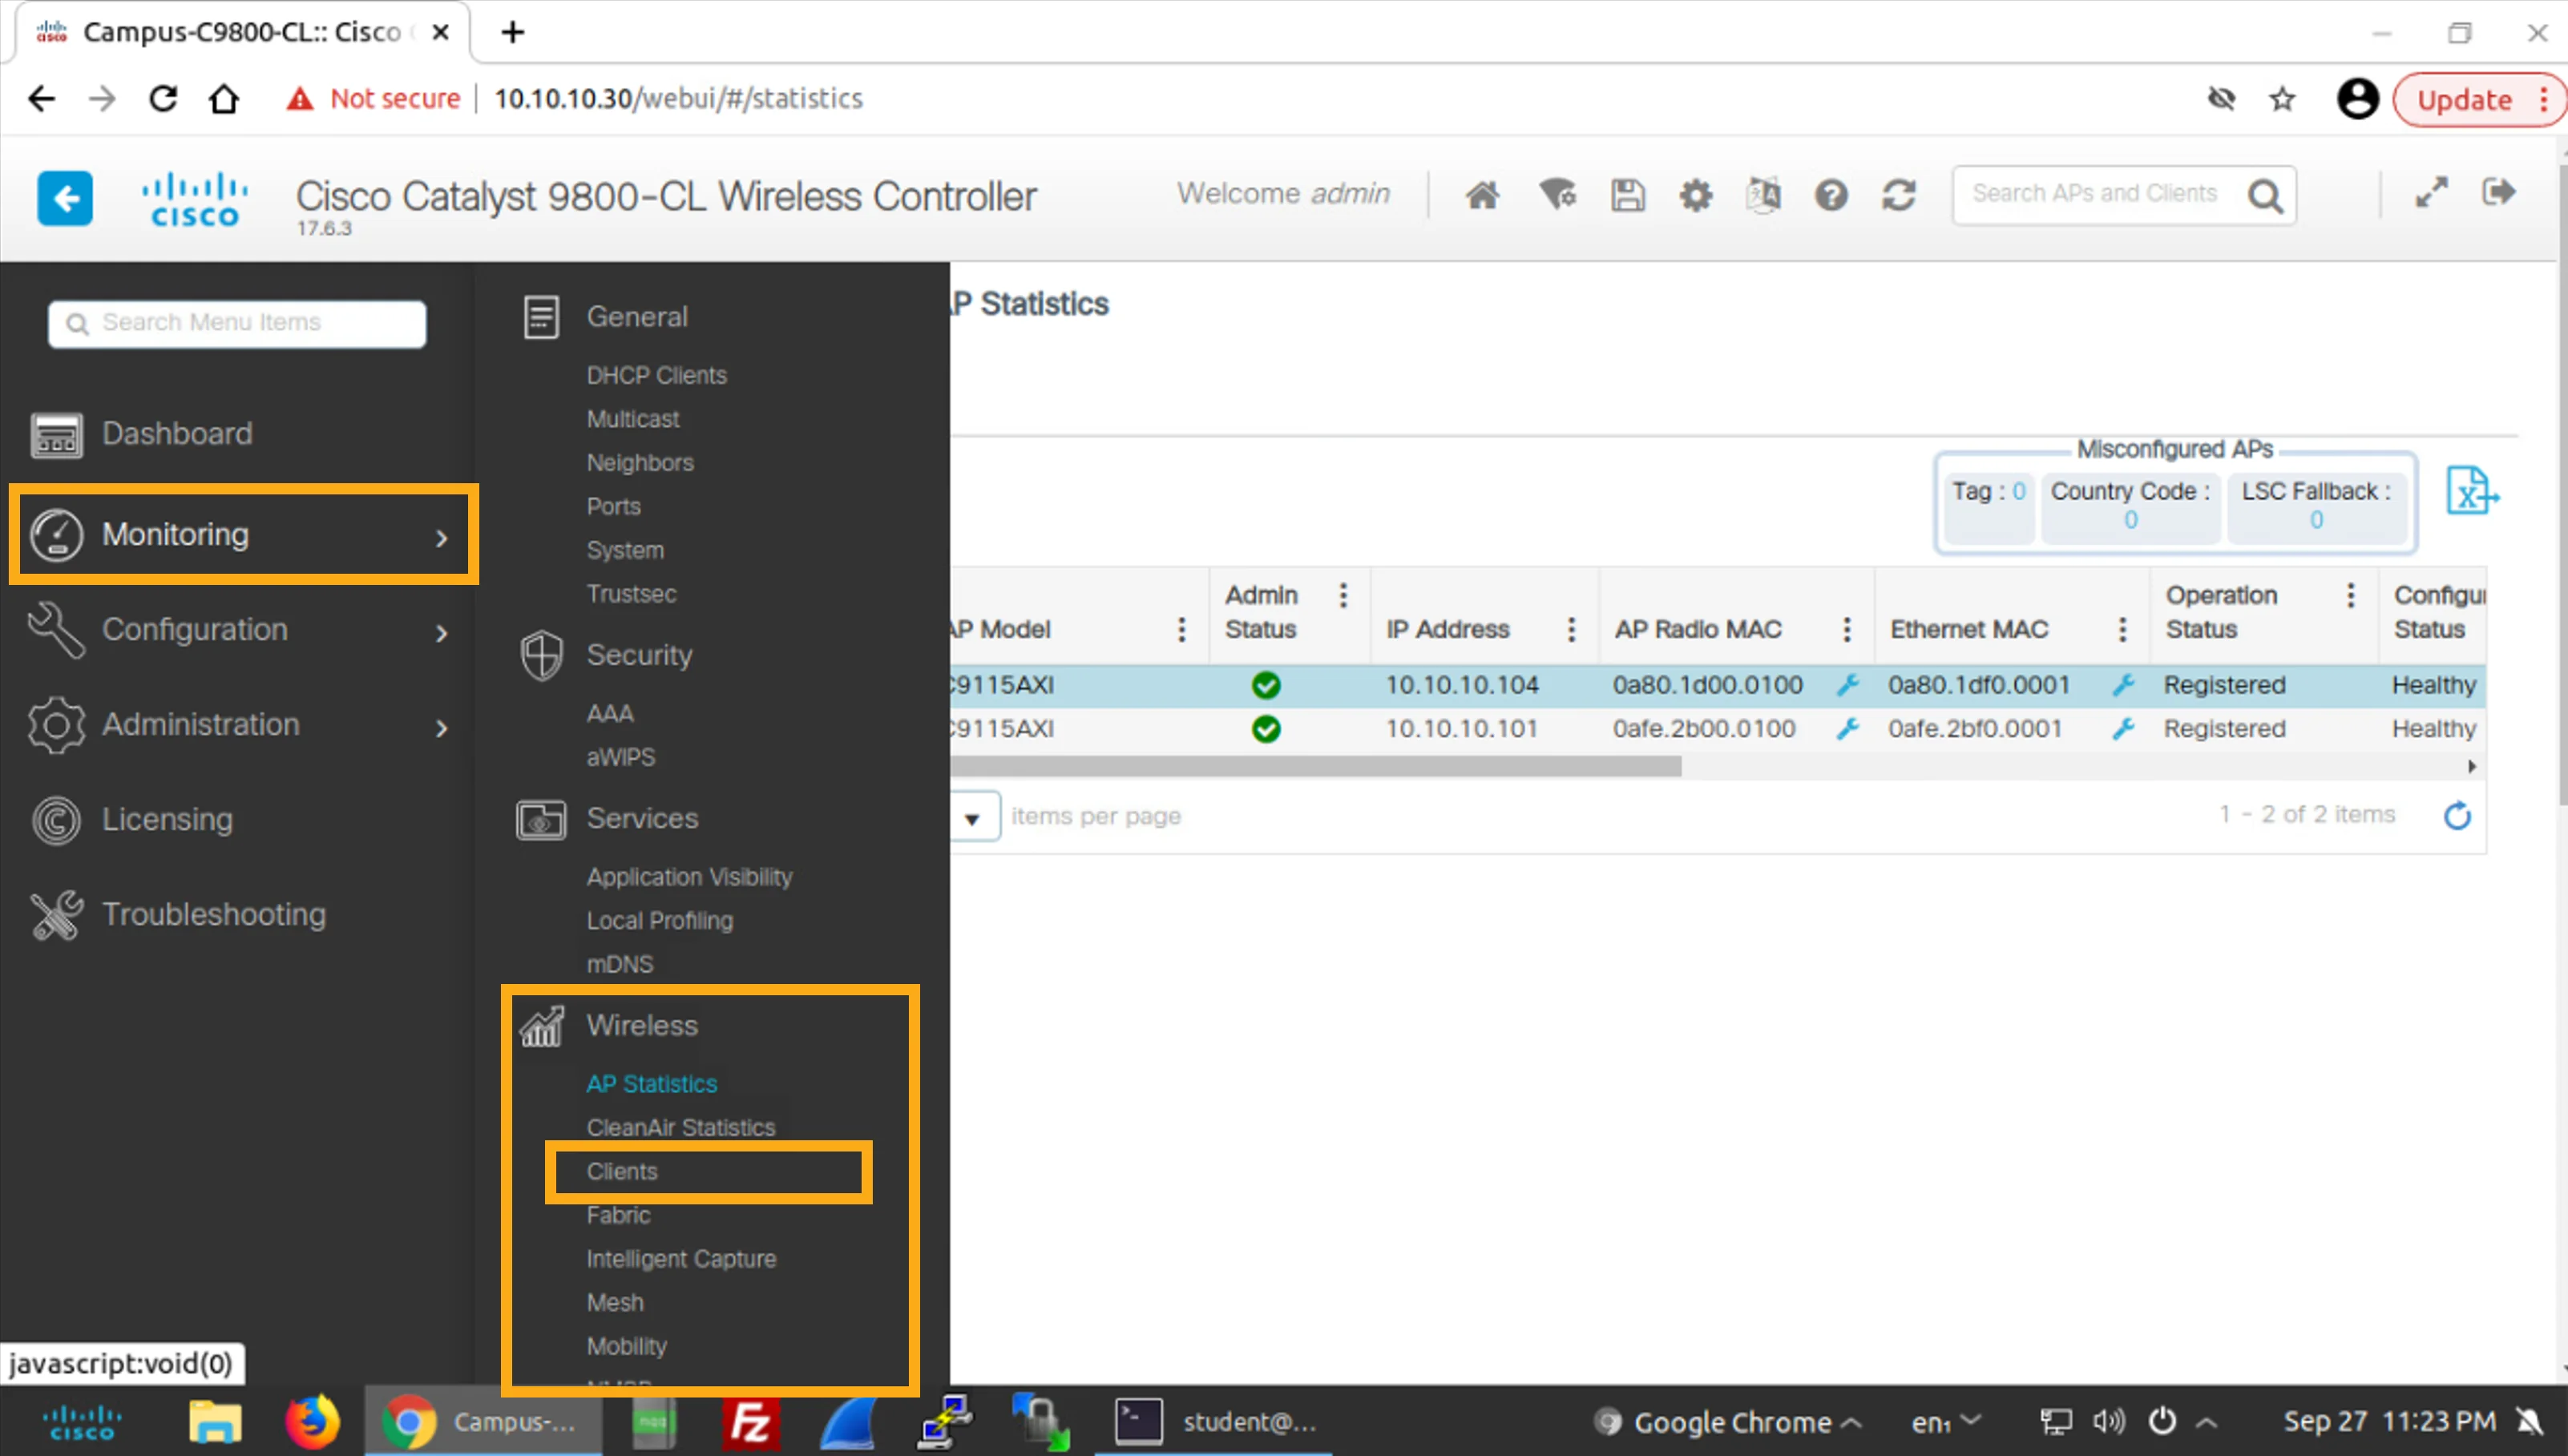
Choose Monitoring > Wireless > Clients to open the wireless Clients page.
選擇 Monitoring > Wireless > Clients,開啟無線 Clients 頁面。
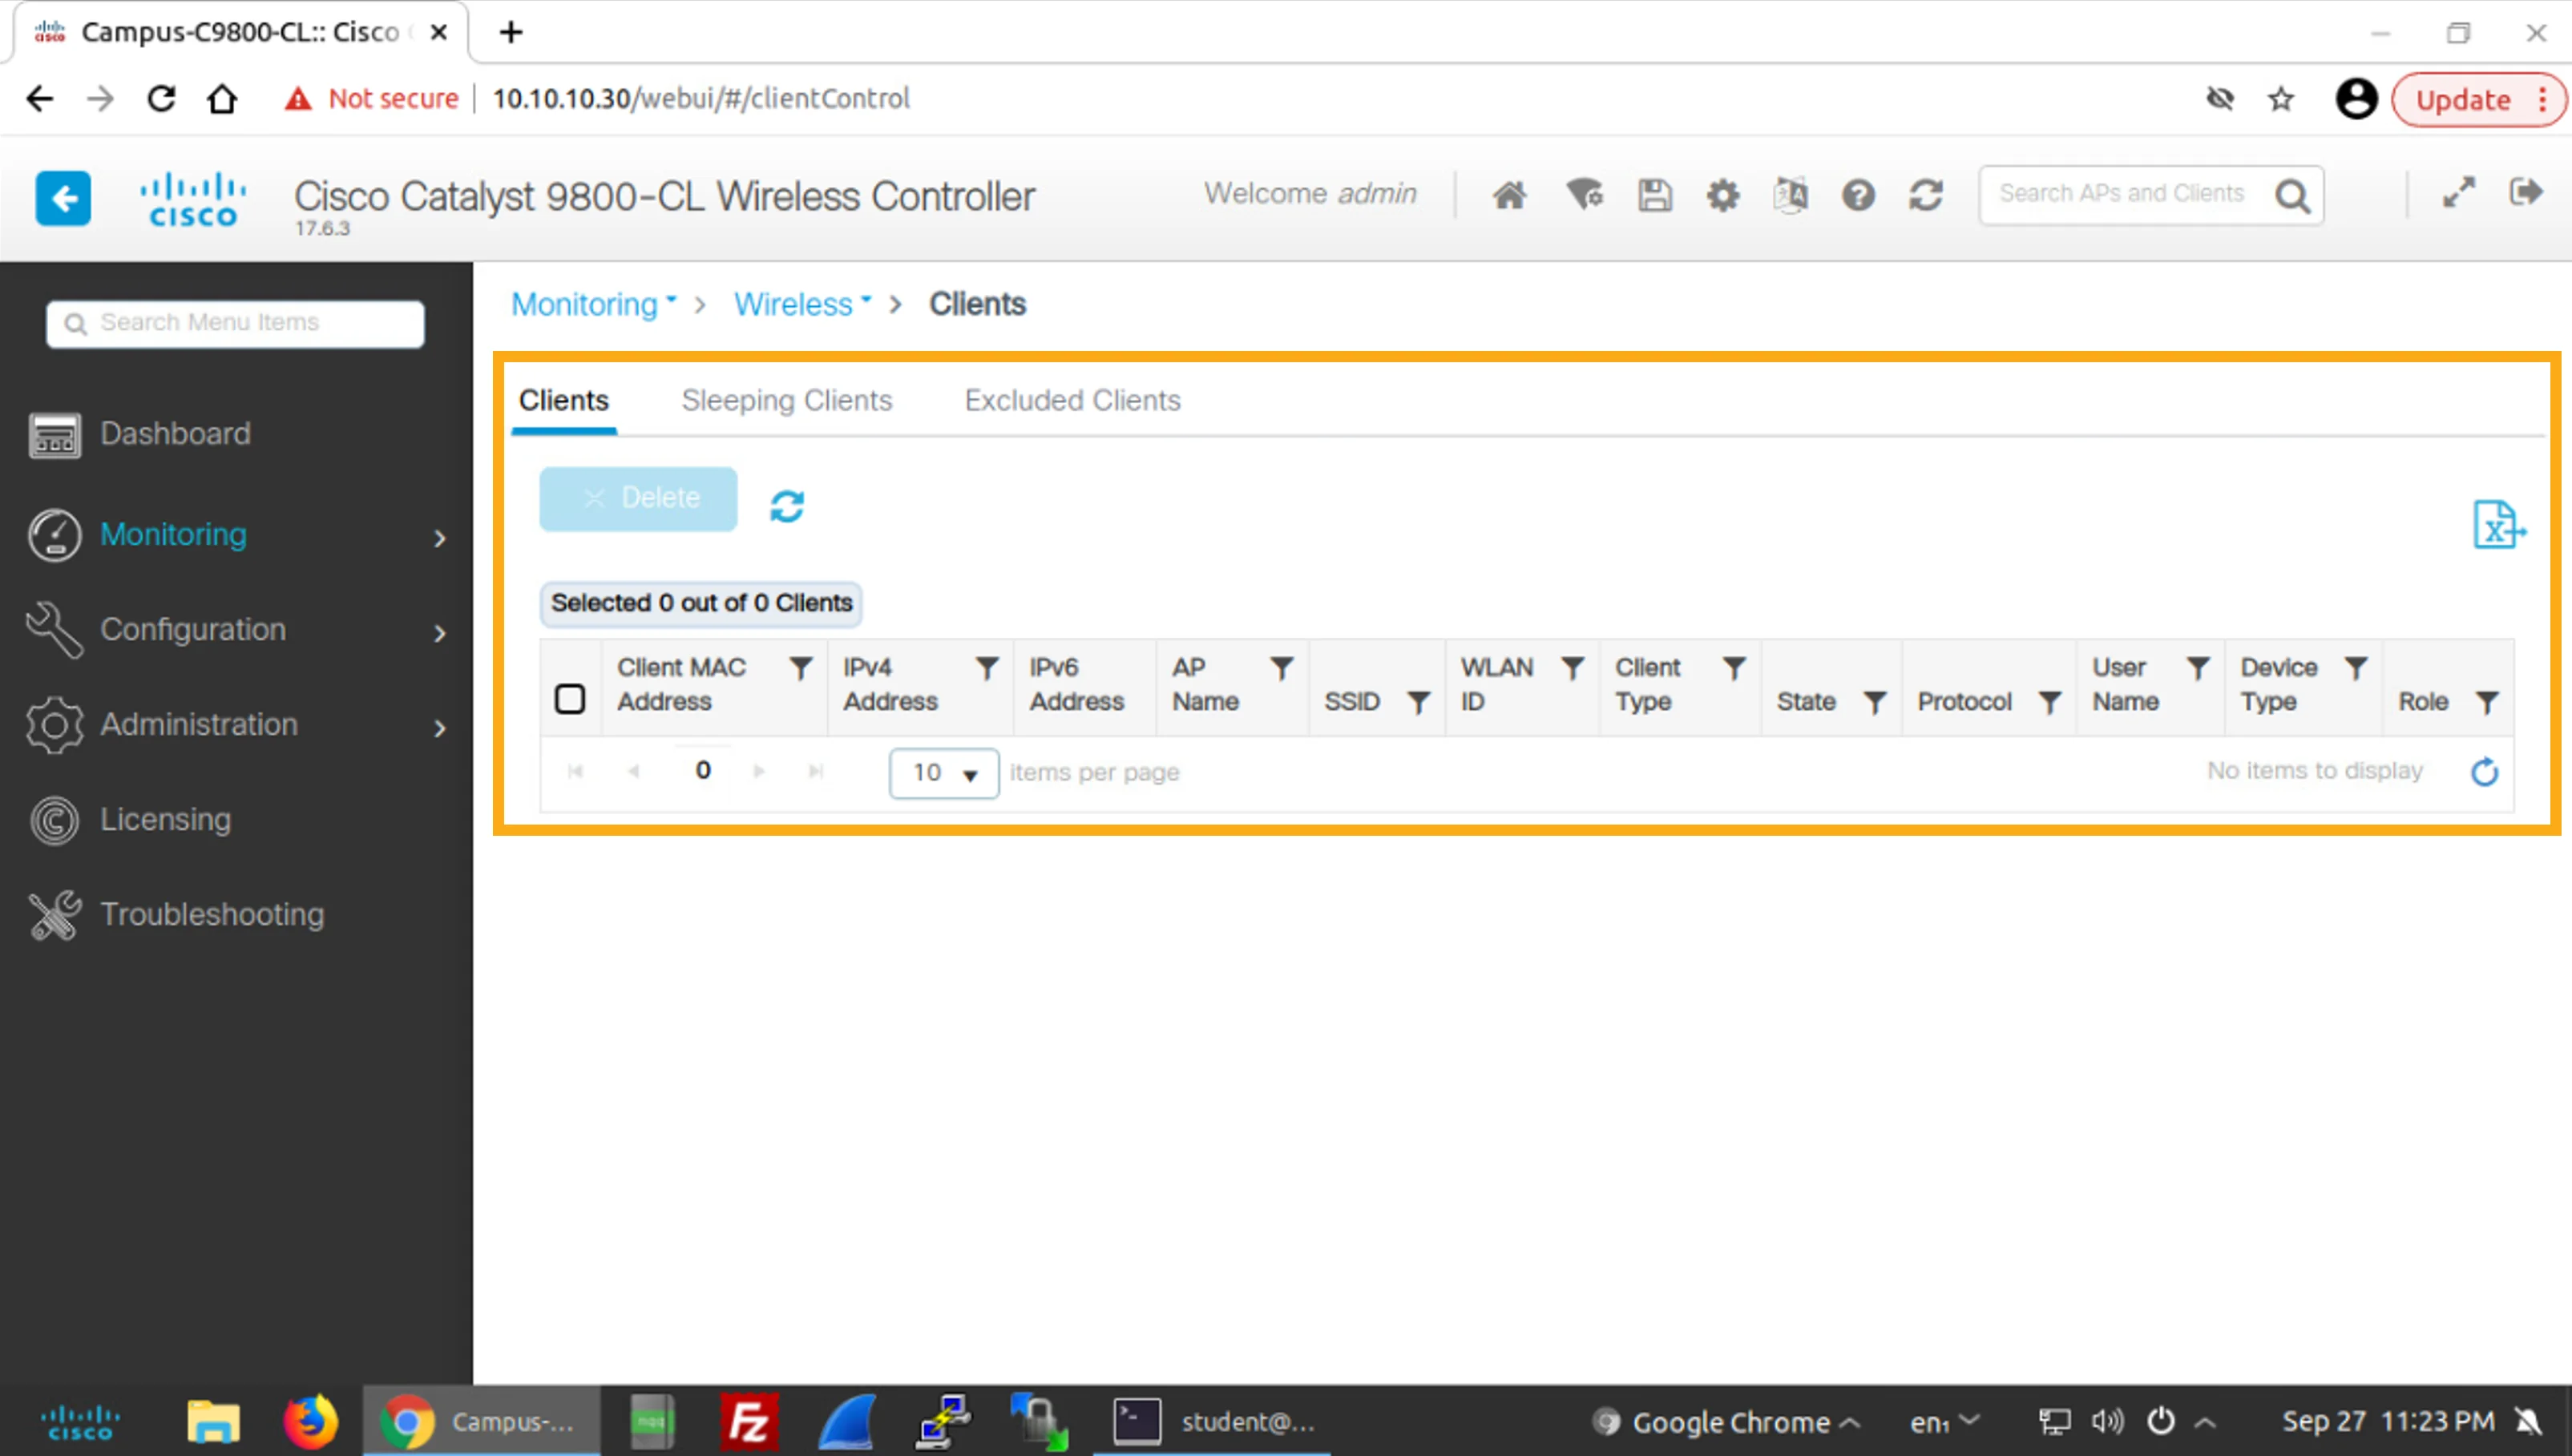
Identify the information categories that are available on the wireless Clients page.
找出無線 Clients 頁面上可用的資訊類別。
The Clients page has three tabs: Clients, Sleeping Clients, and Excluded Clients. Currently, the list of clients is empty because of the incomplete configuration and lack of clients.
Clients 頁面有三個標籤頁:Clients、Sleeping Clients 與 Excluded Clients。目前由於設定尚未完成且沒有用戶端,用戶端清單是空的。
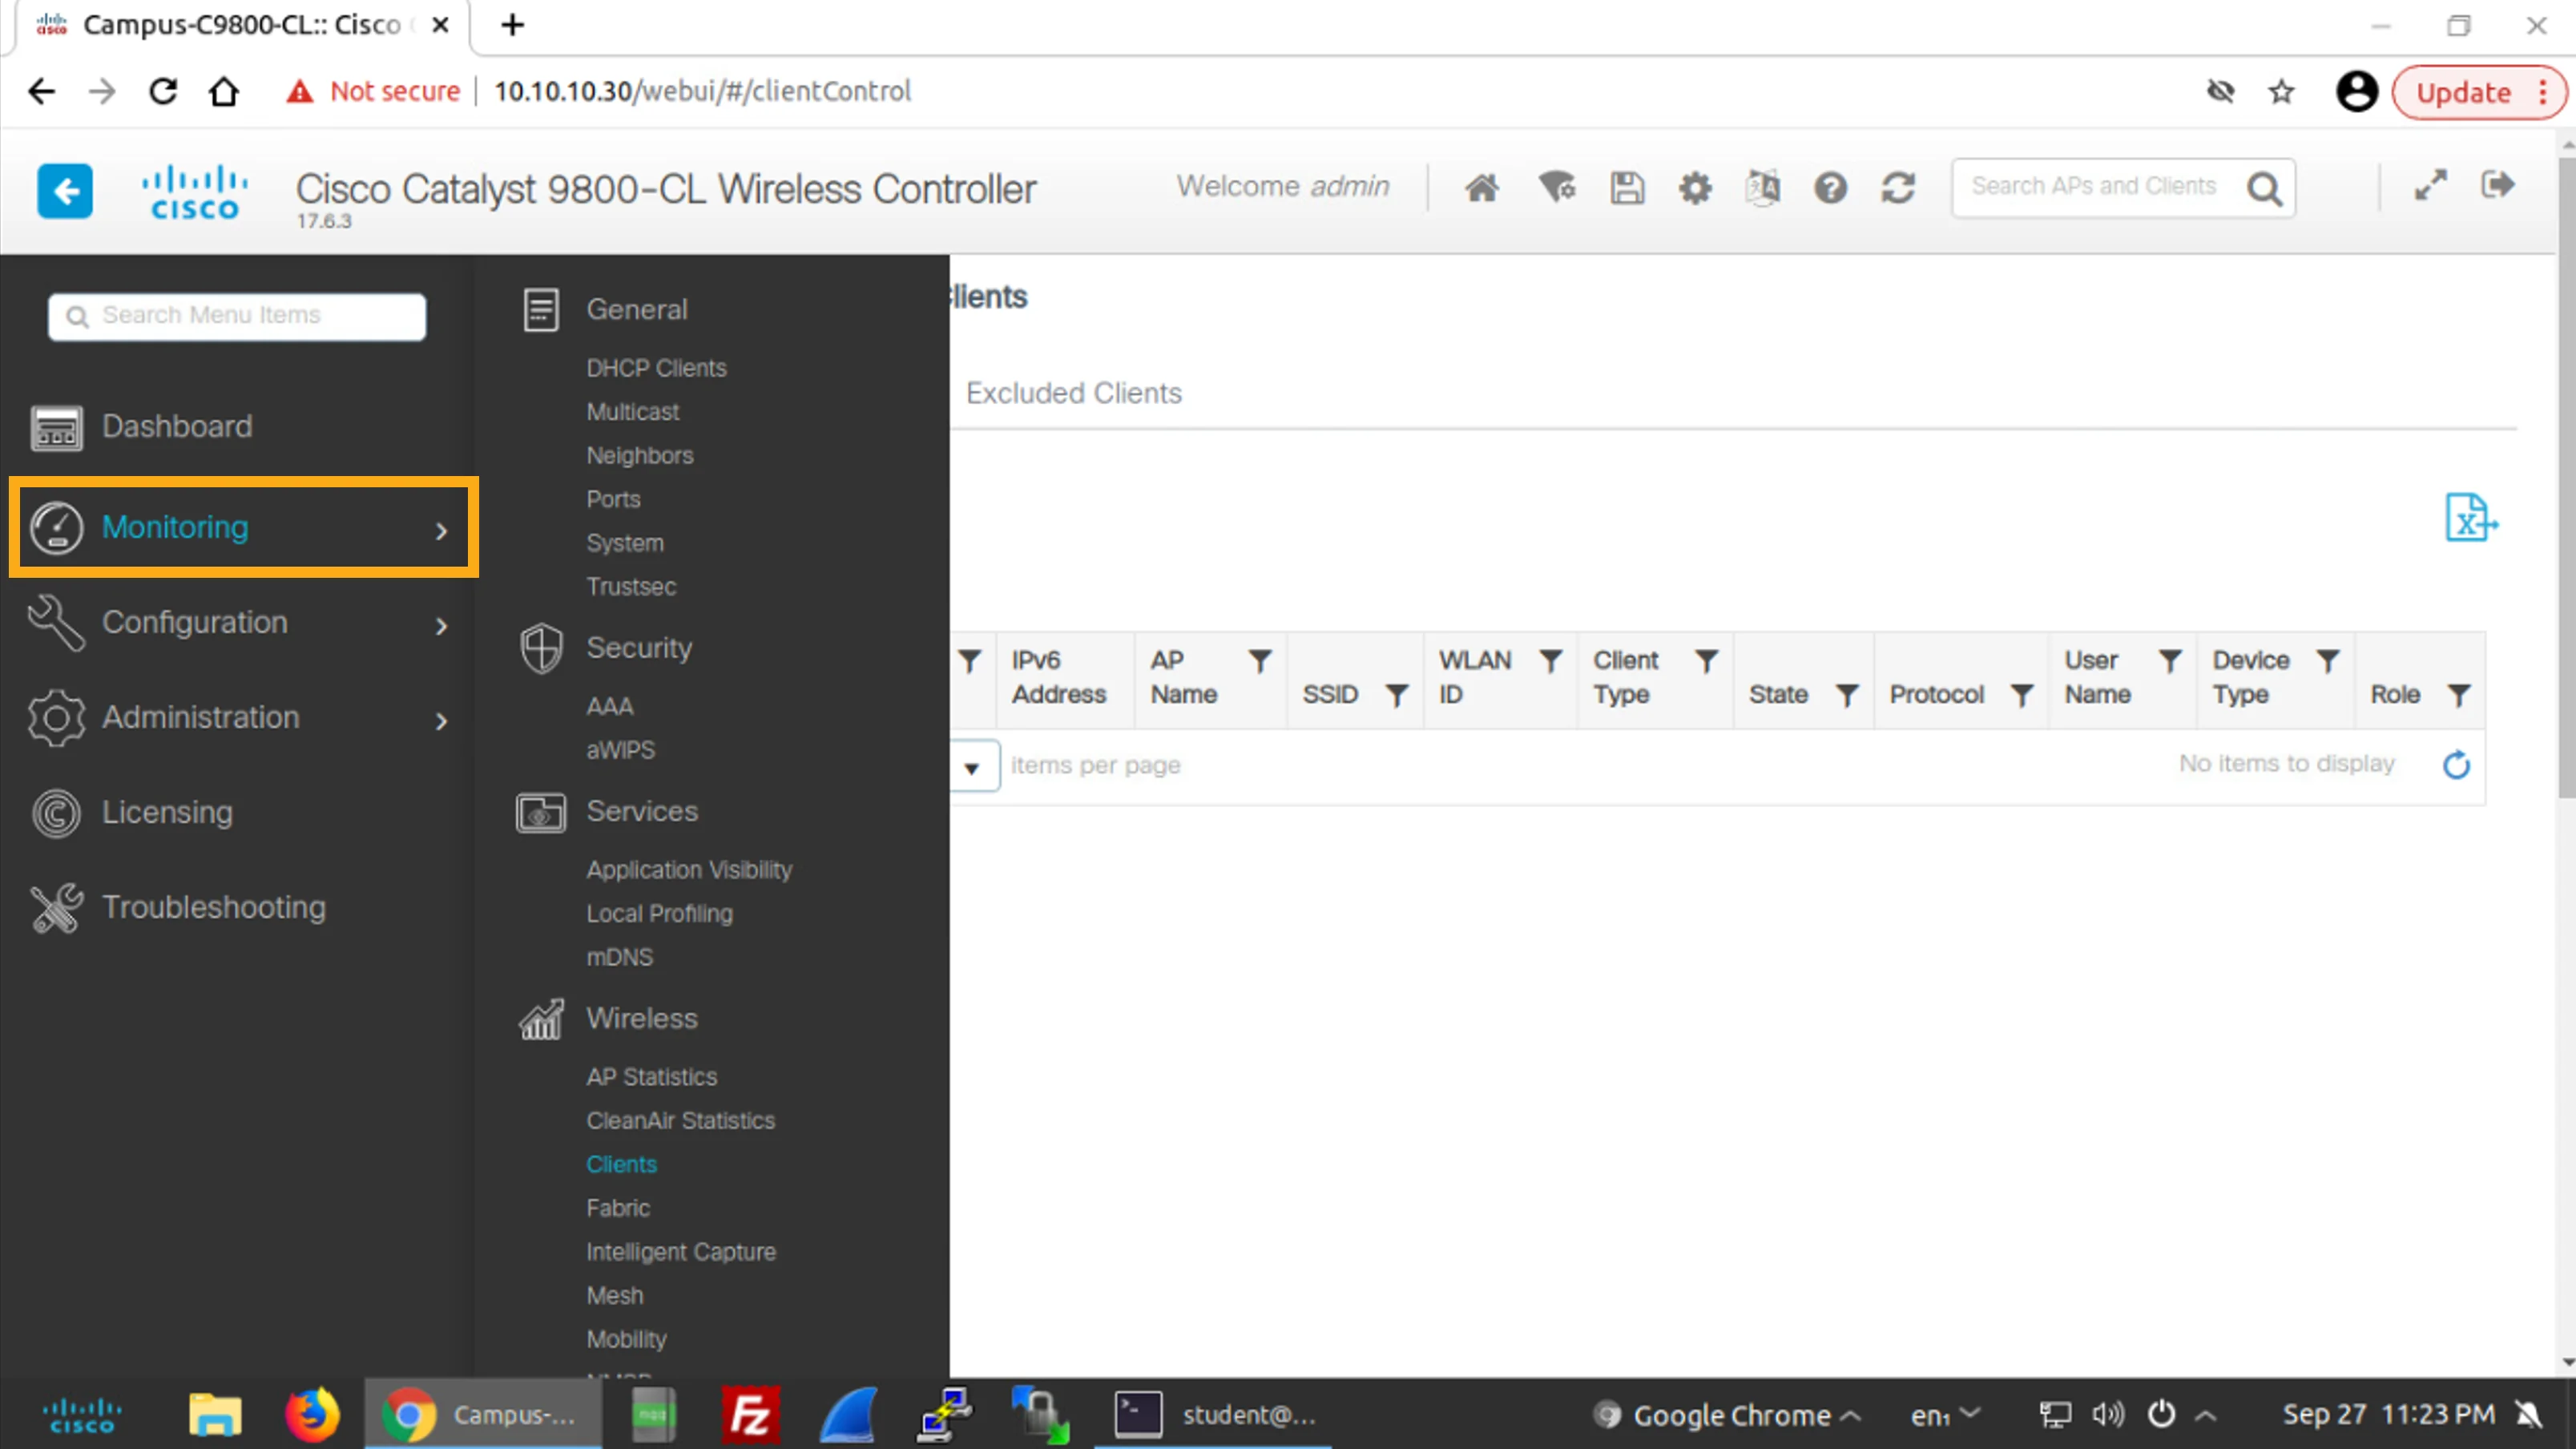
Choose Monitoring > Wireless > Radio Statistics to open the Radio Statistics page.
選擇 Monitoring > Wireless > Radio Statistics,開啟 Radio Statistics 頁面。
First, click Monitoring.
首先,點按 Monitoring。
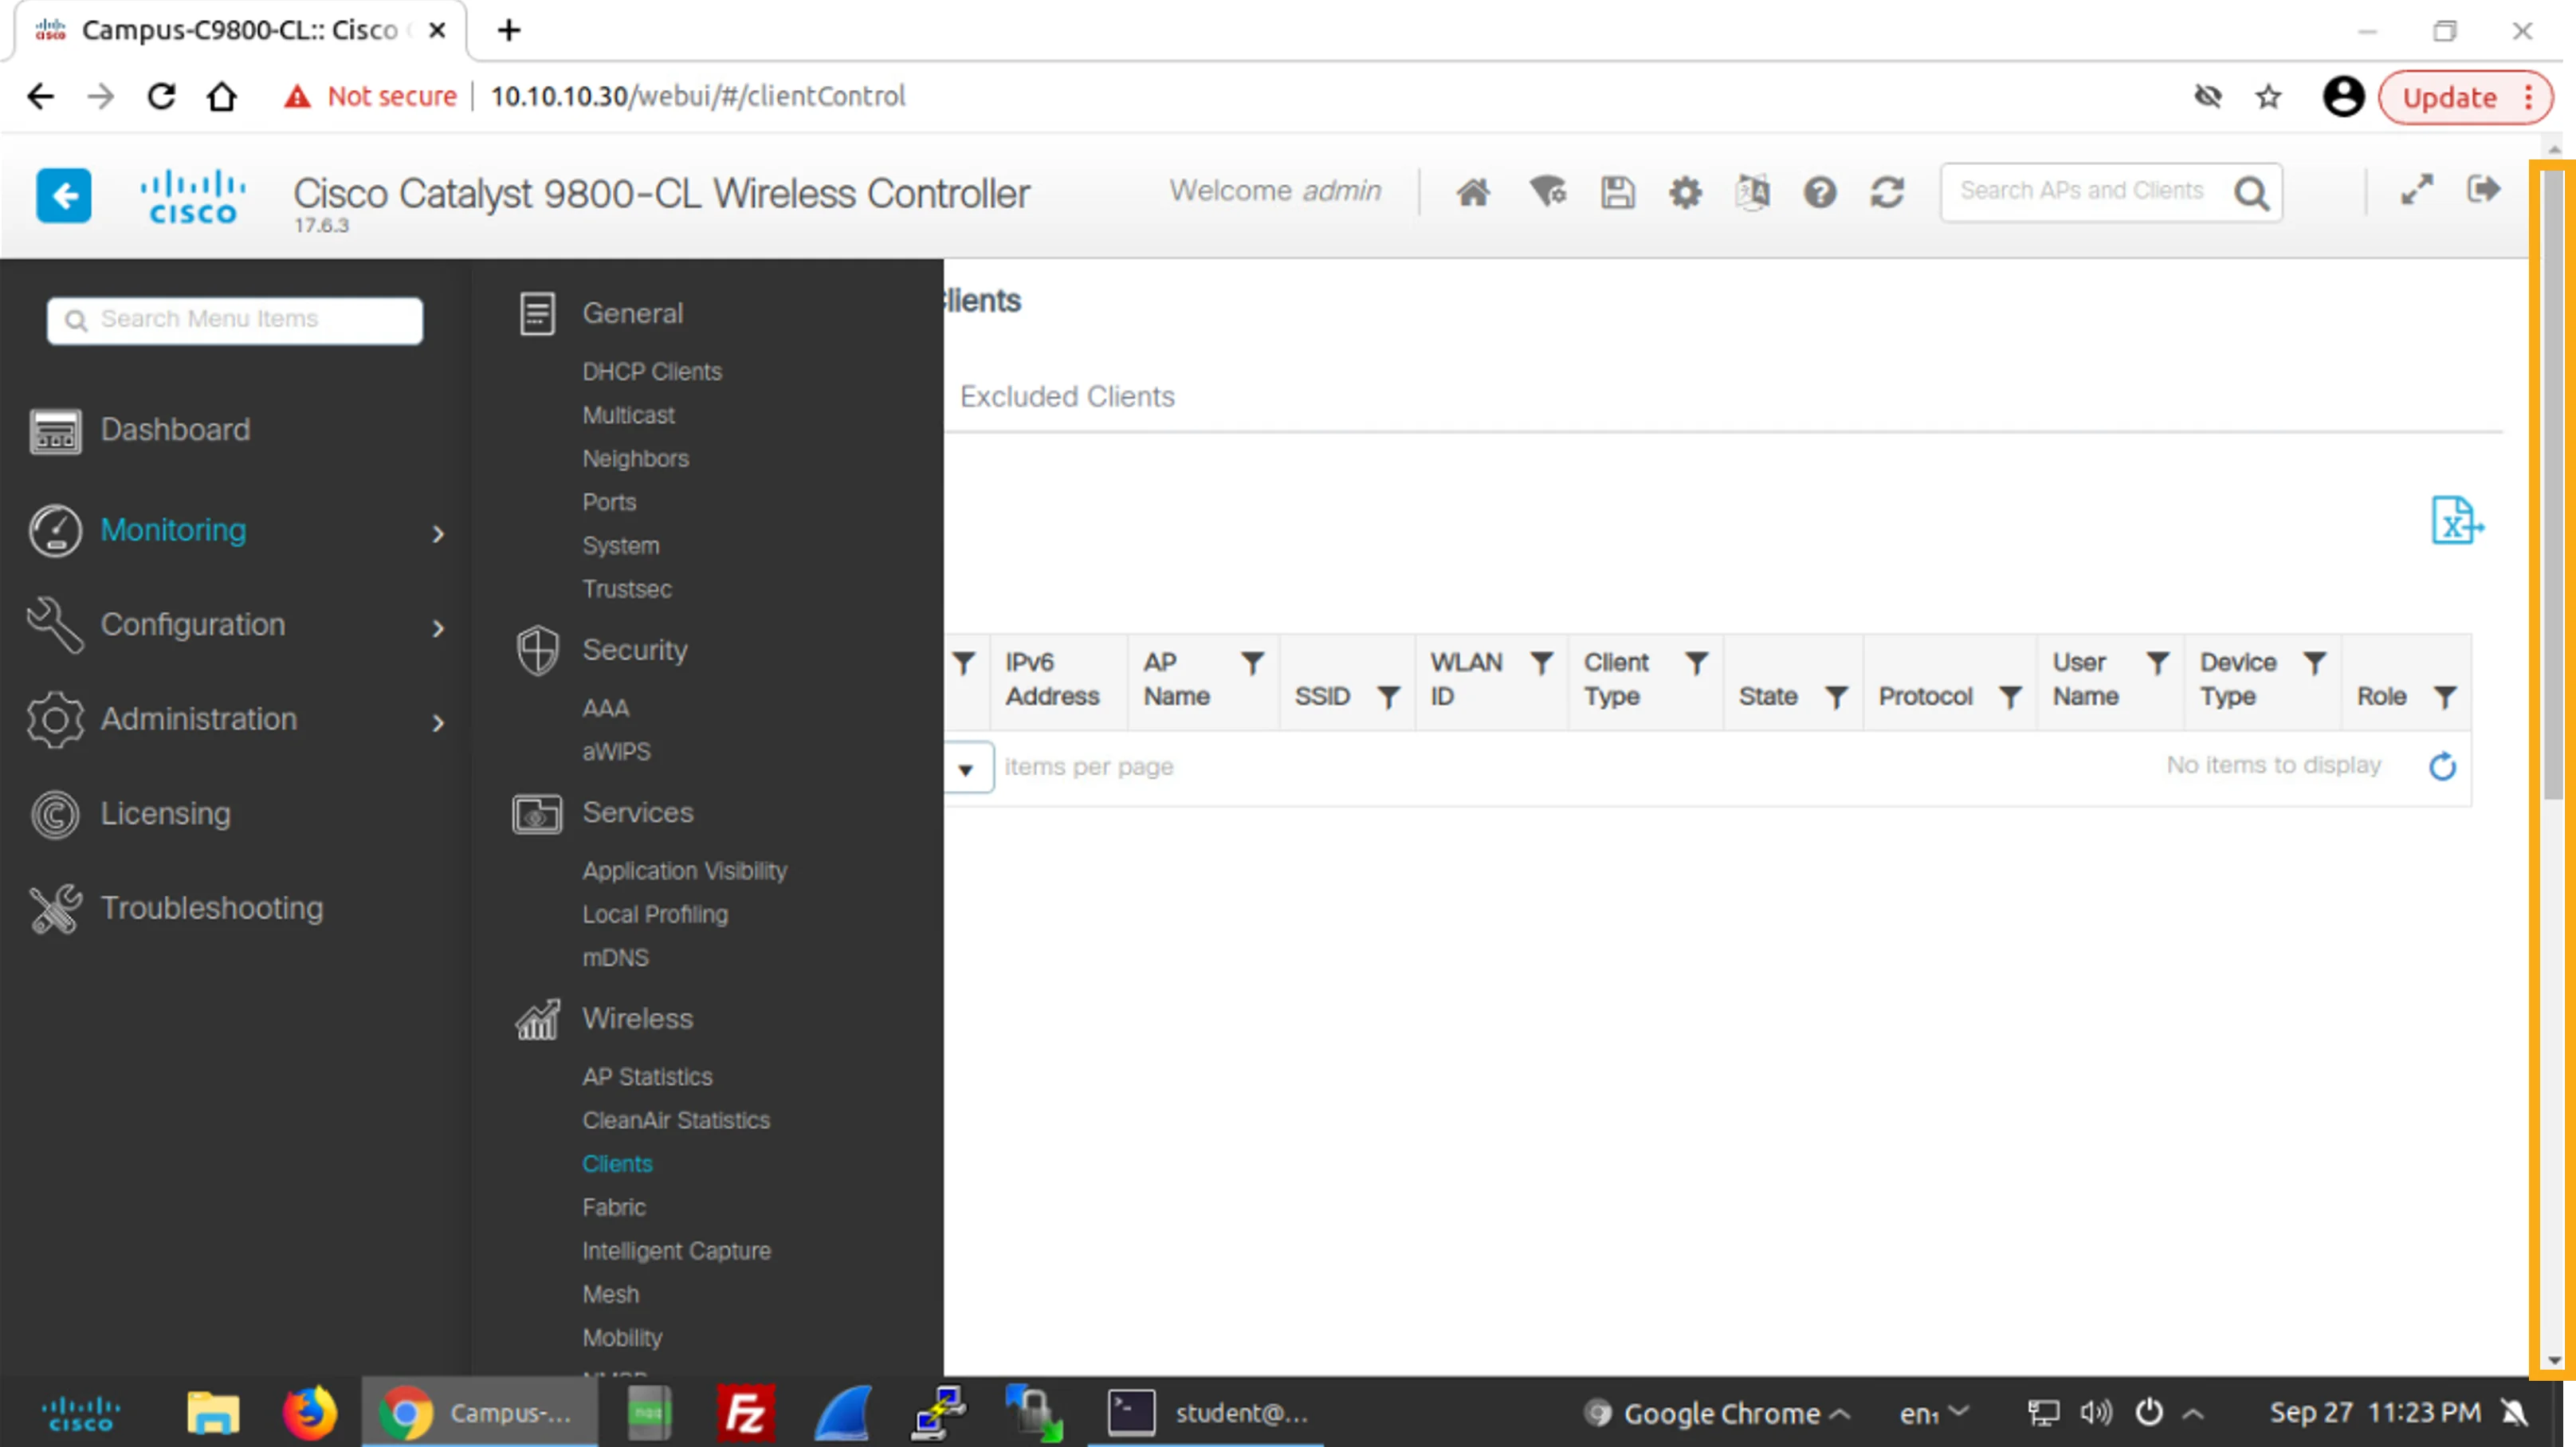
Then, scroll down the page by clicking in the scroll bar area.
接著,點按捲軸區域向下捲動頁面。
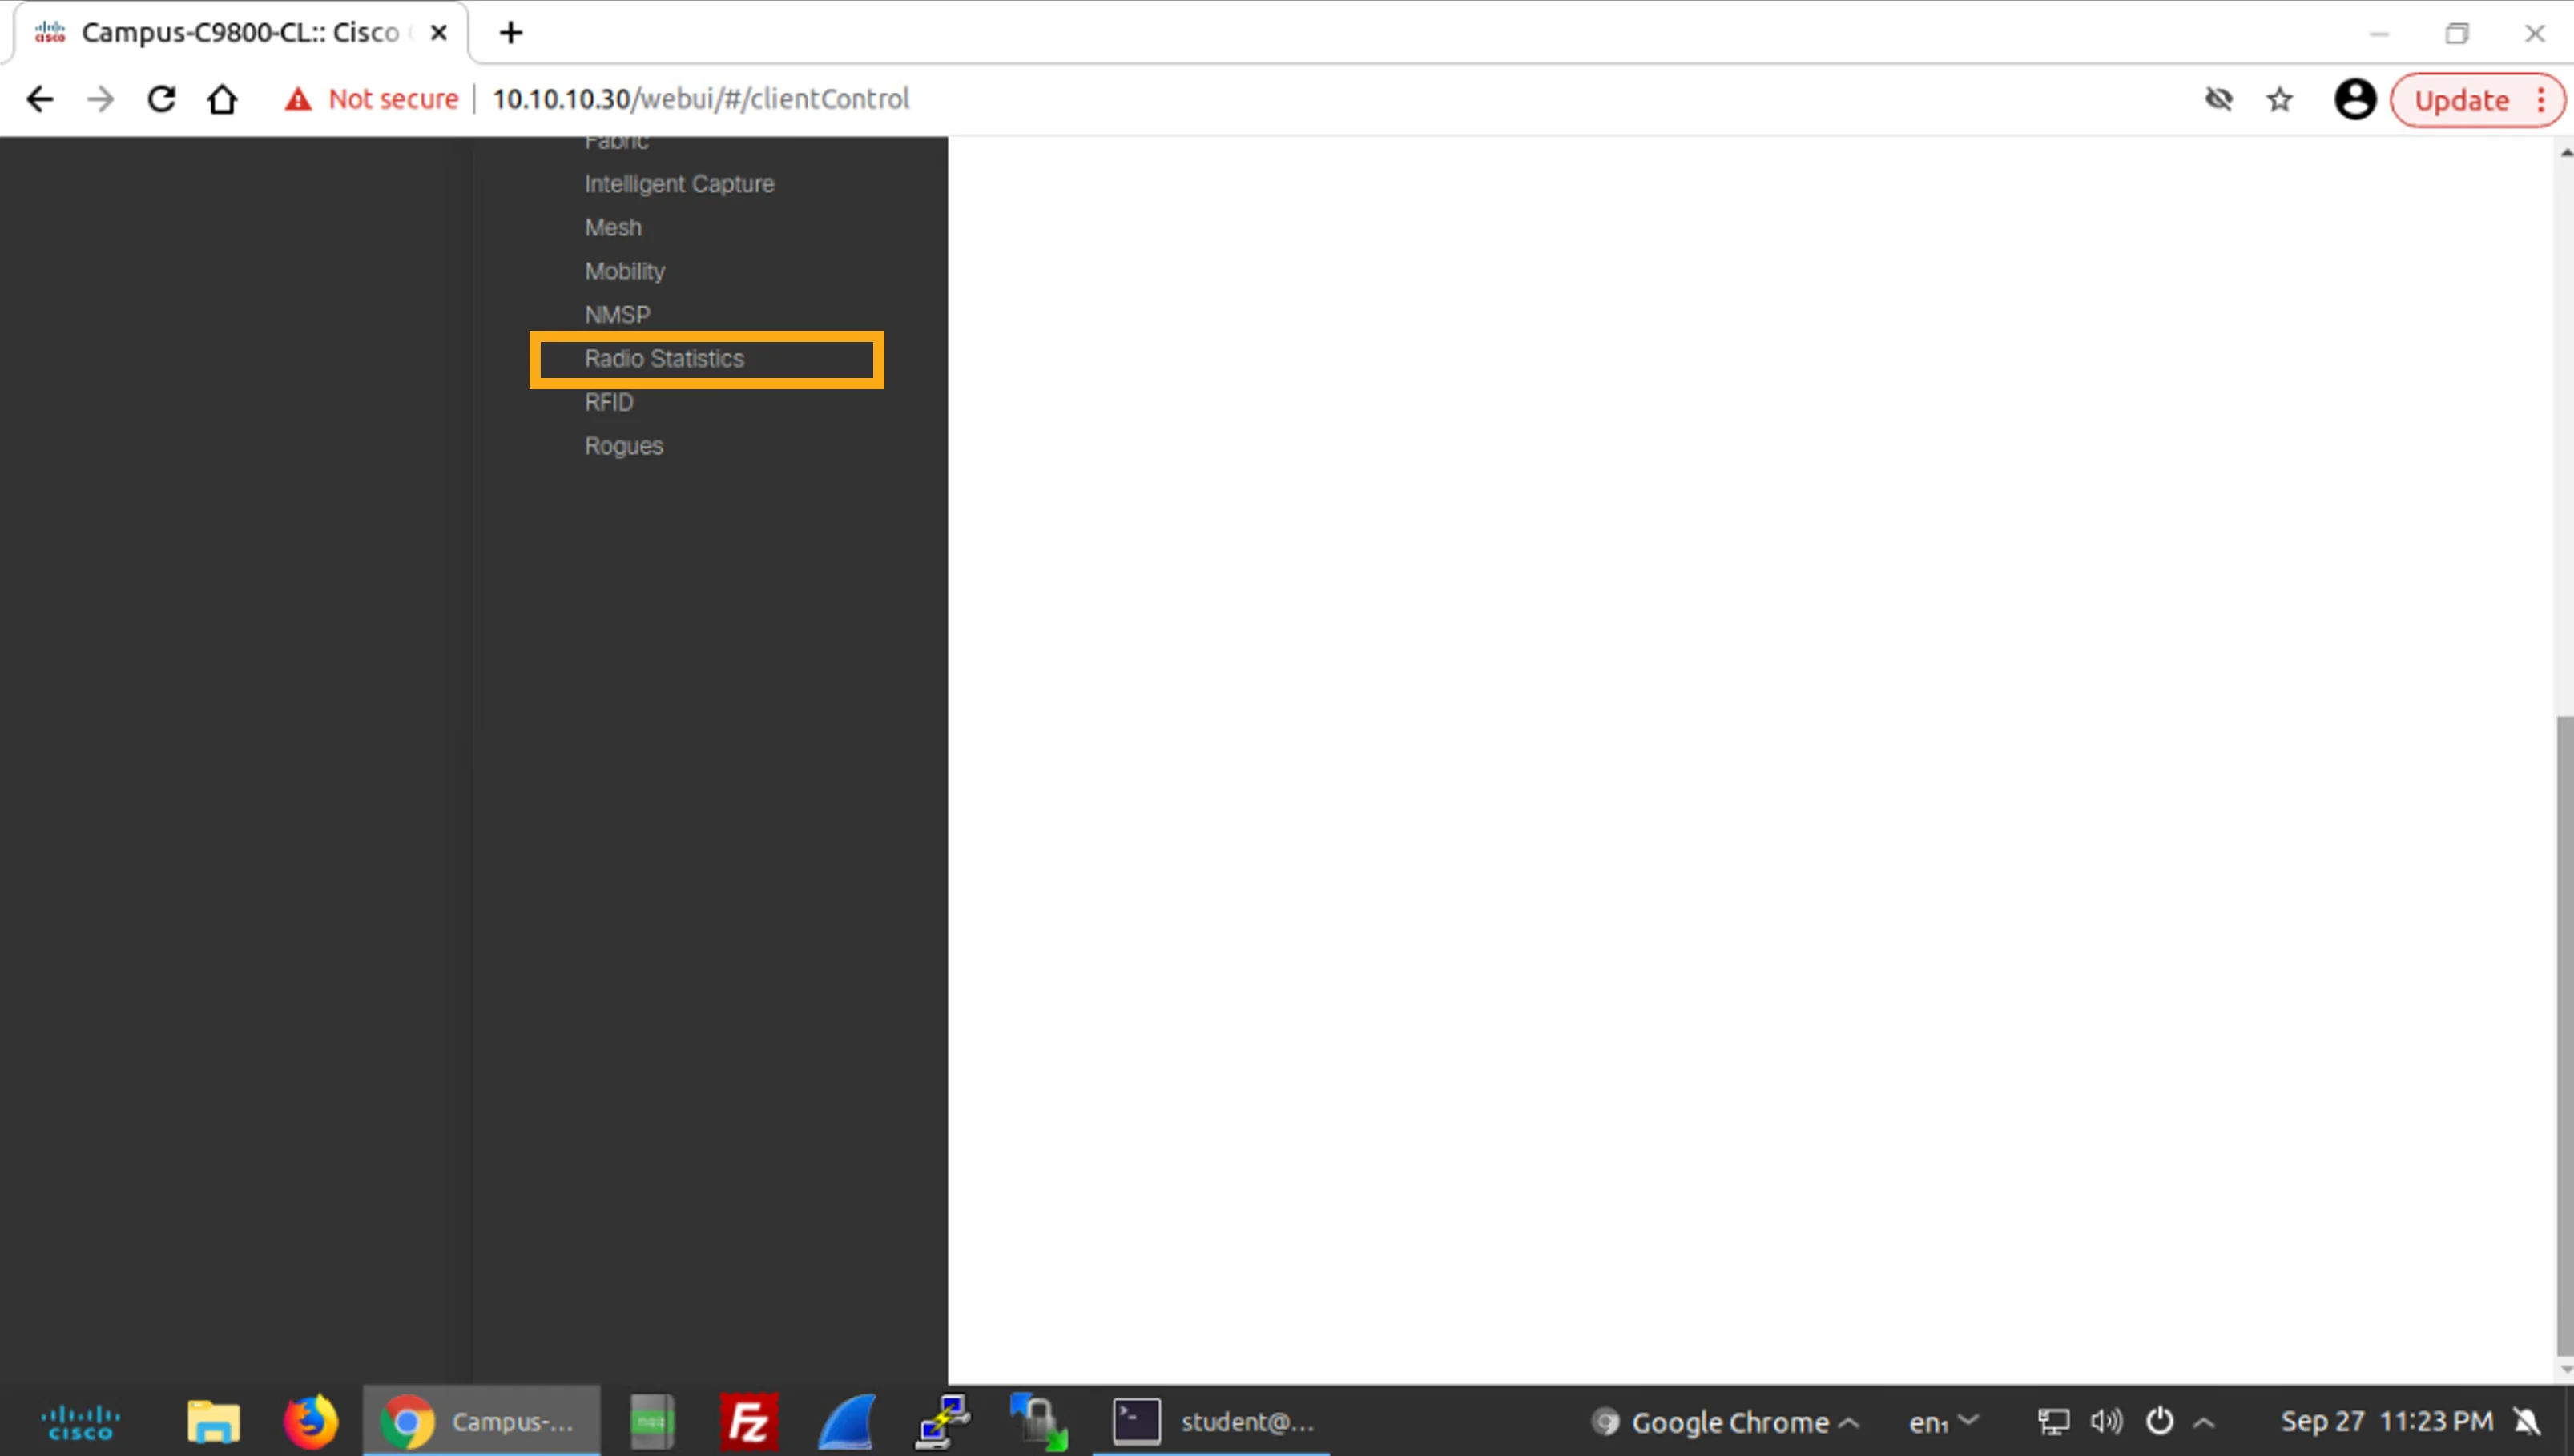
Finally, click Radio Statistics.
最後,點按 Radio Statistics。
Identify the three tabs on the Radio Statistics page.
找出 Radio Statistics 頁面上的三個標籤頁。
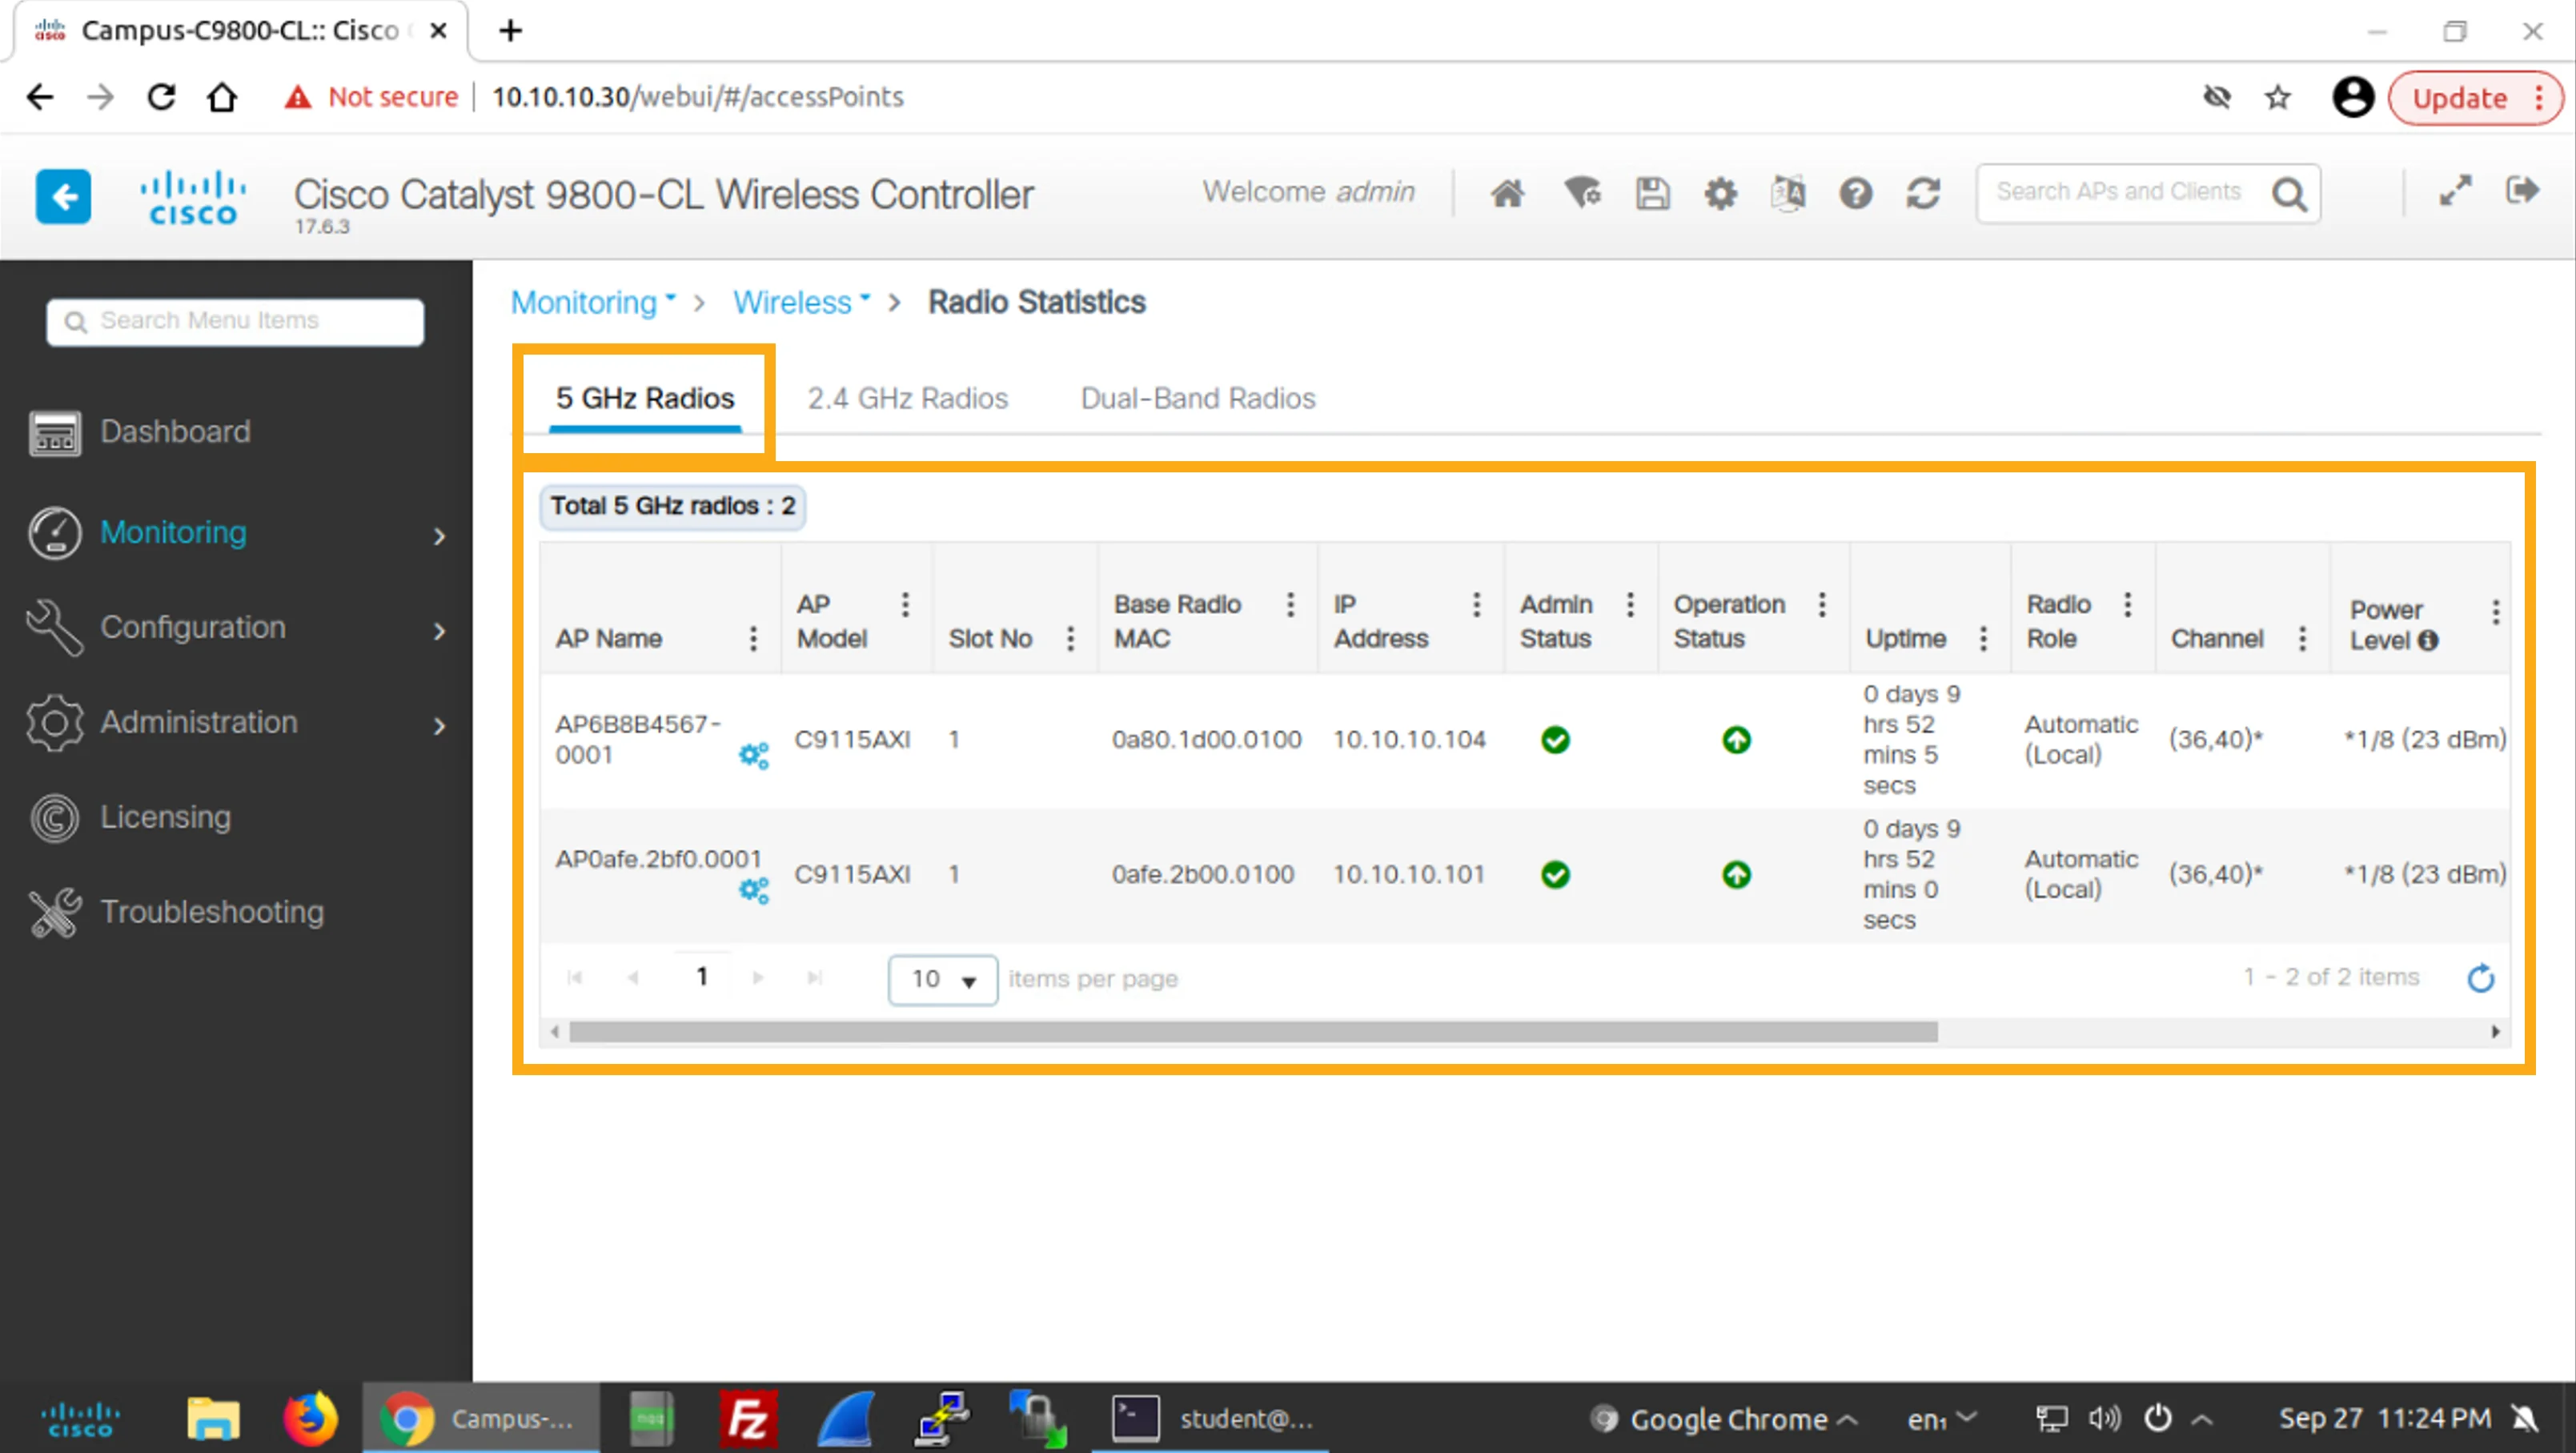
The tabs are 5 GHz Radios, 2.4 GHz Radios, and Dual-Band Radios.
這些標籤頁分別是 5 GHz Radios、2.4 GHz Radios 與 Dual-Band Radios。
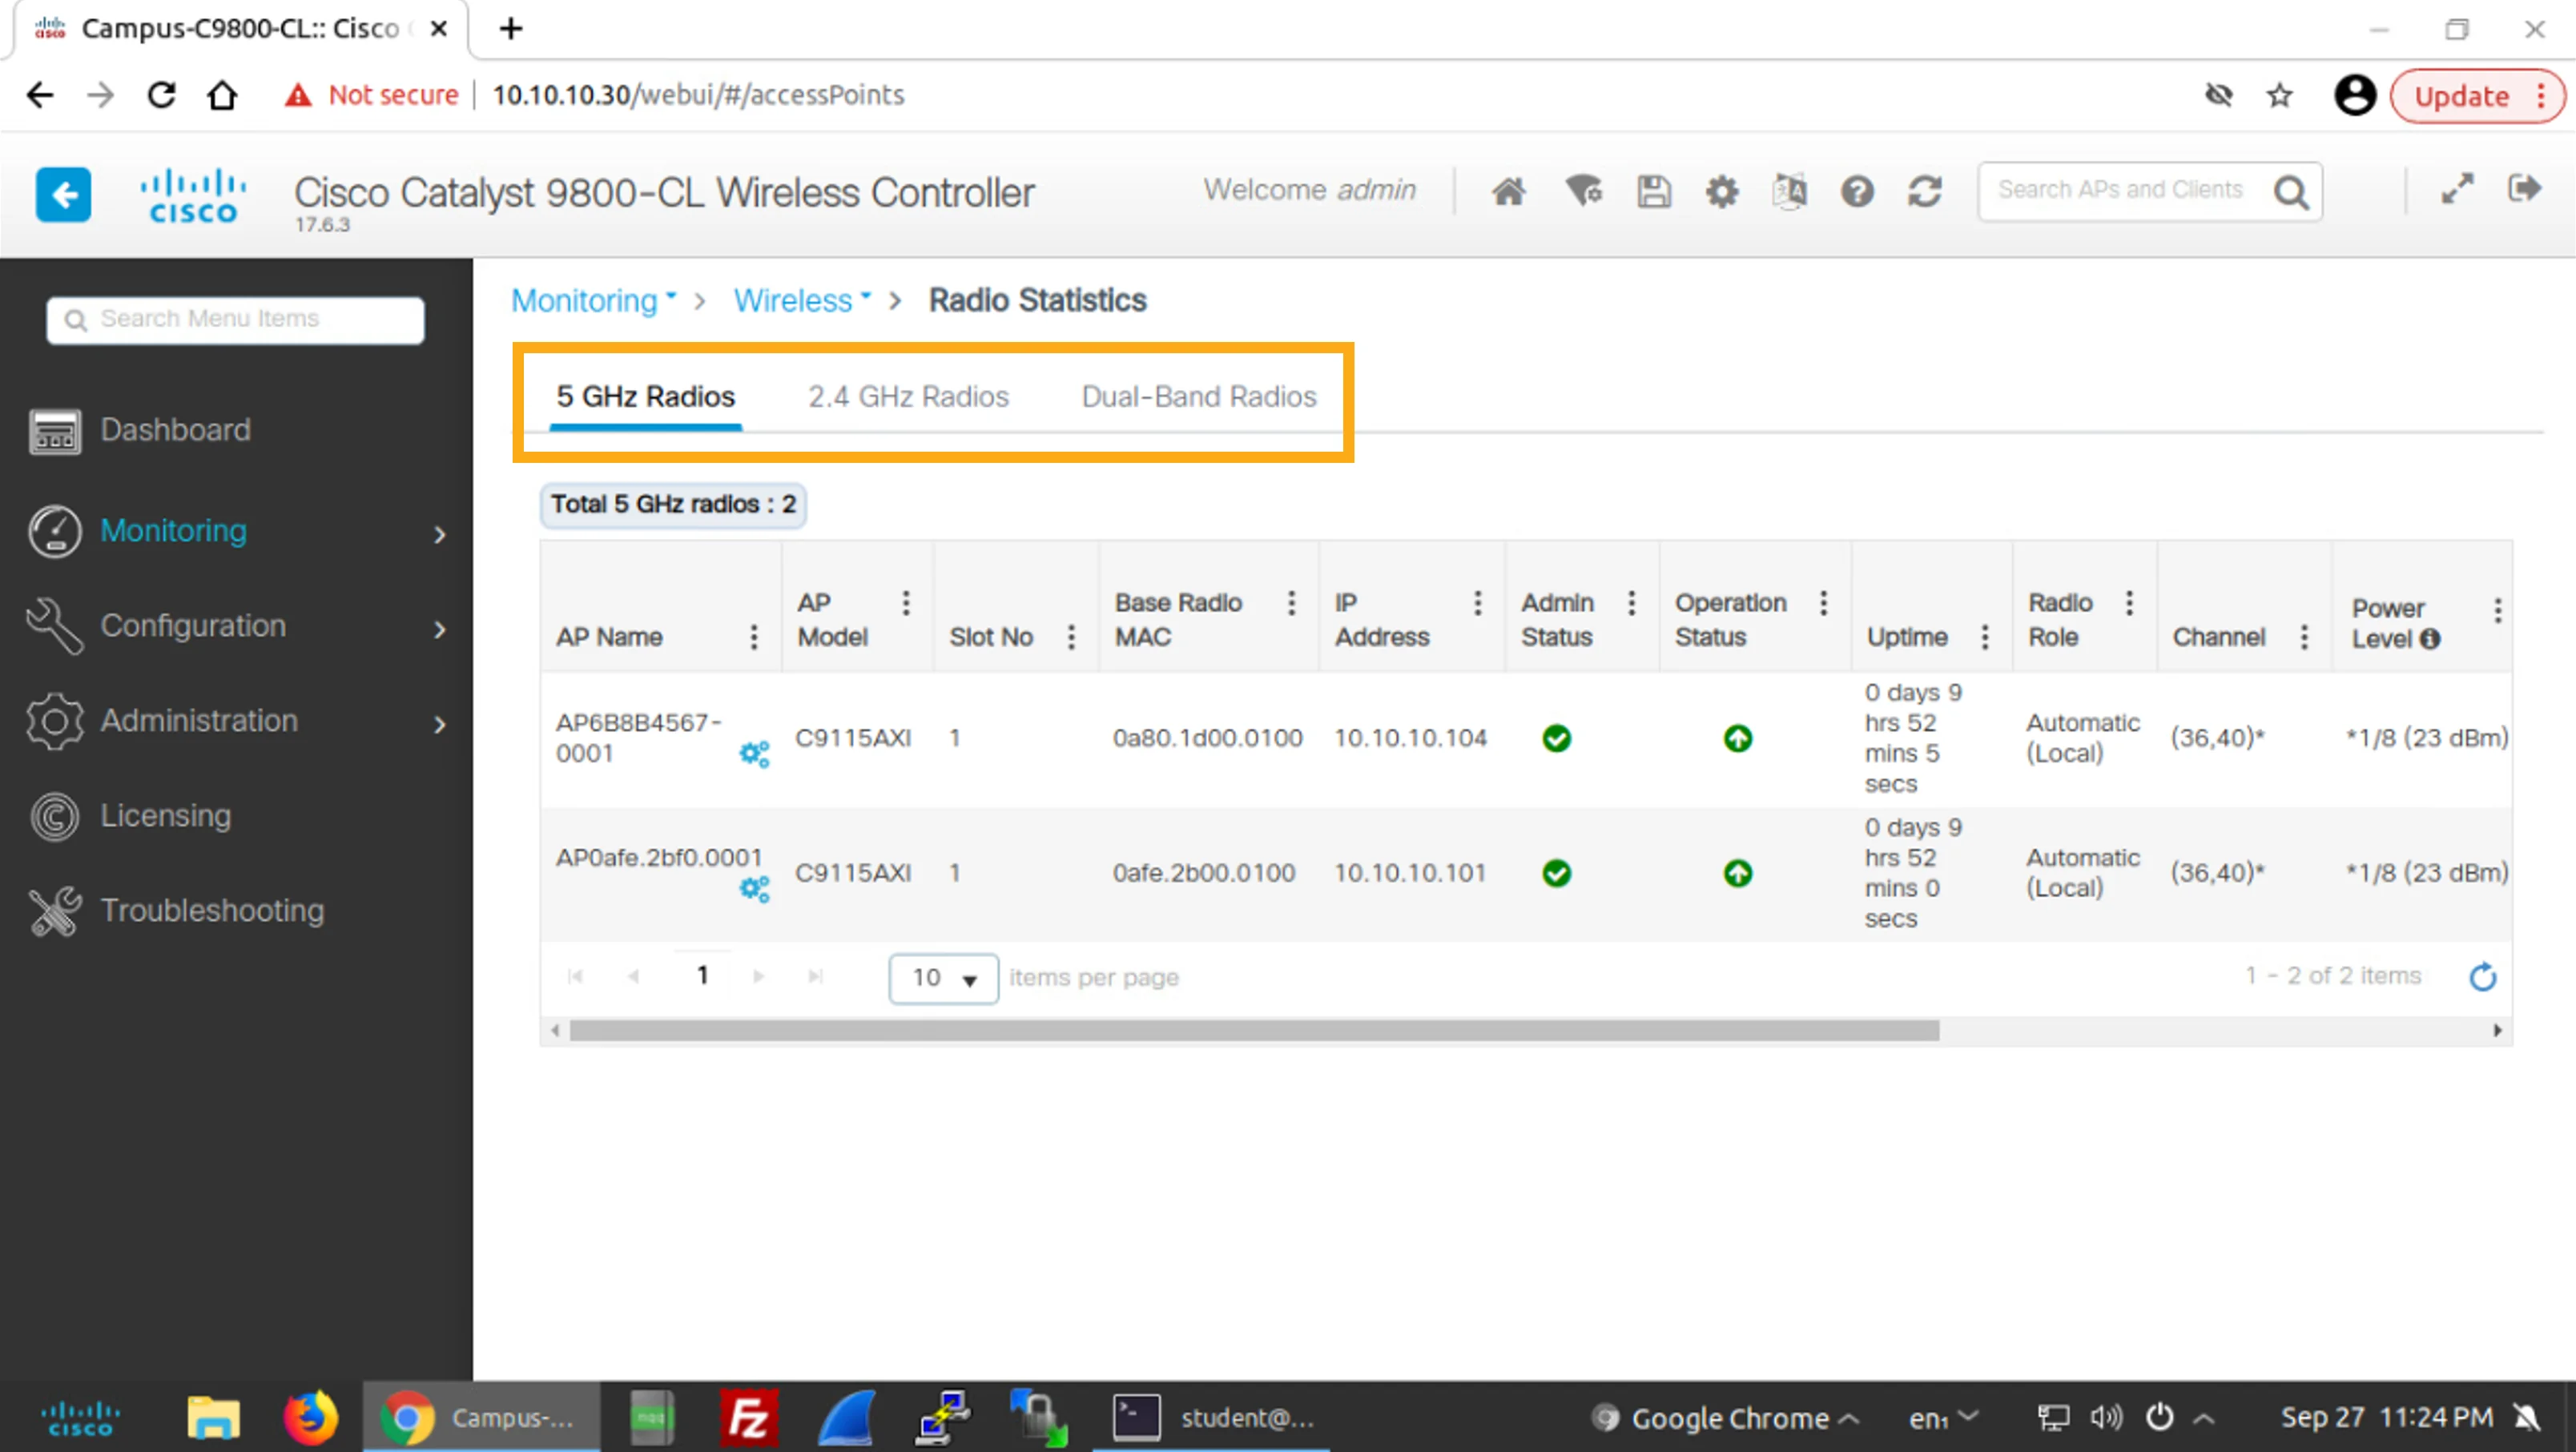
Observe the list of APs in the 5 GHz Radios tab and examine the information that is provided in the list.
觀察 5 GHz Radios 標籤頁中的 AP 清單,並檢視清單中提供的資訊。
The list of APs includes the AP name, model, its IP and MAC addresses, administrative and operational status, uptime, and information about the channels and the power level.
AP 清單包括 AP 名稱、機型、IP 與 MAC 位址、管理狀態與運作狀態、運作時間,以及頻道與功率等級的相關資訊。
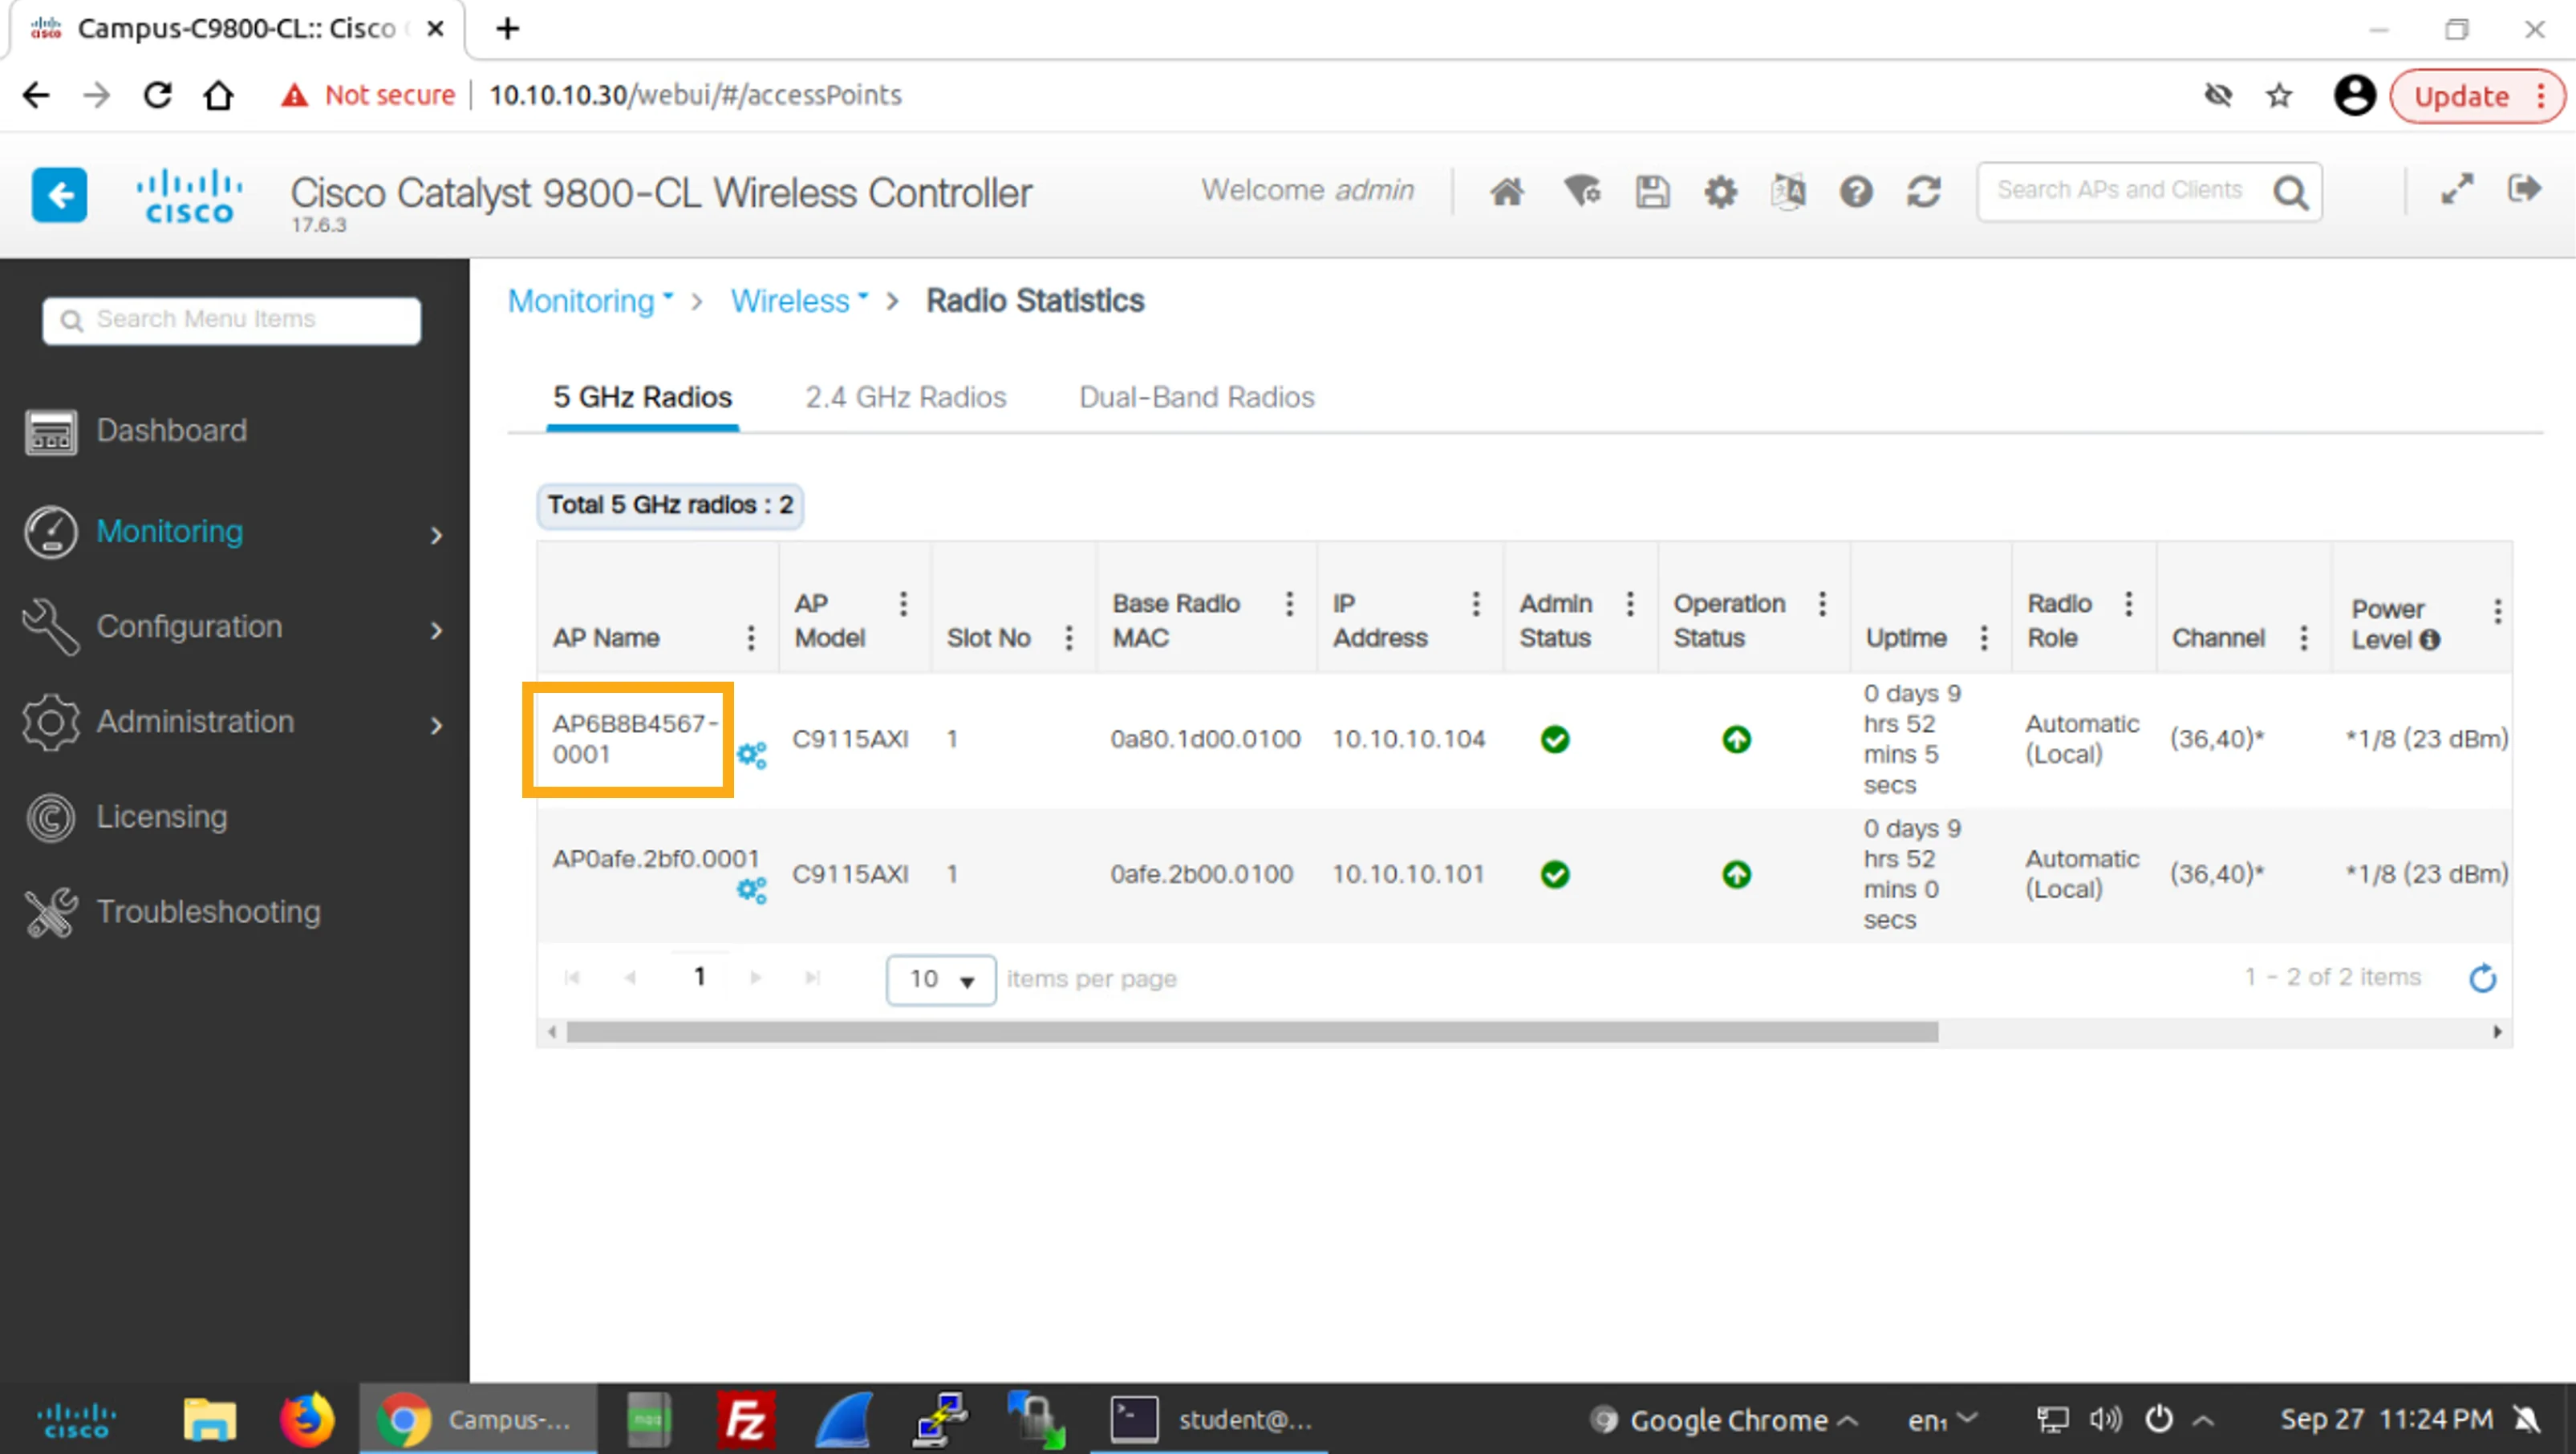
Click the first AP in the list (AP6B8B4567-0001) to display even more details about the AP.
點按清單中的第一個 AP(AP6B8B4567-0001),顯示該 AP 更多的詳細資料。
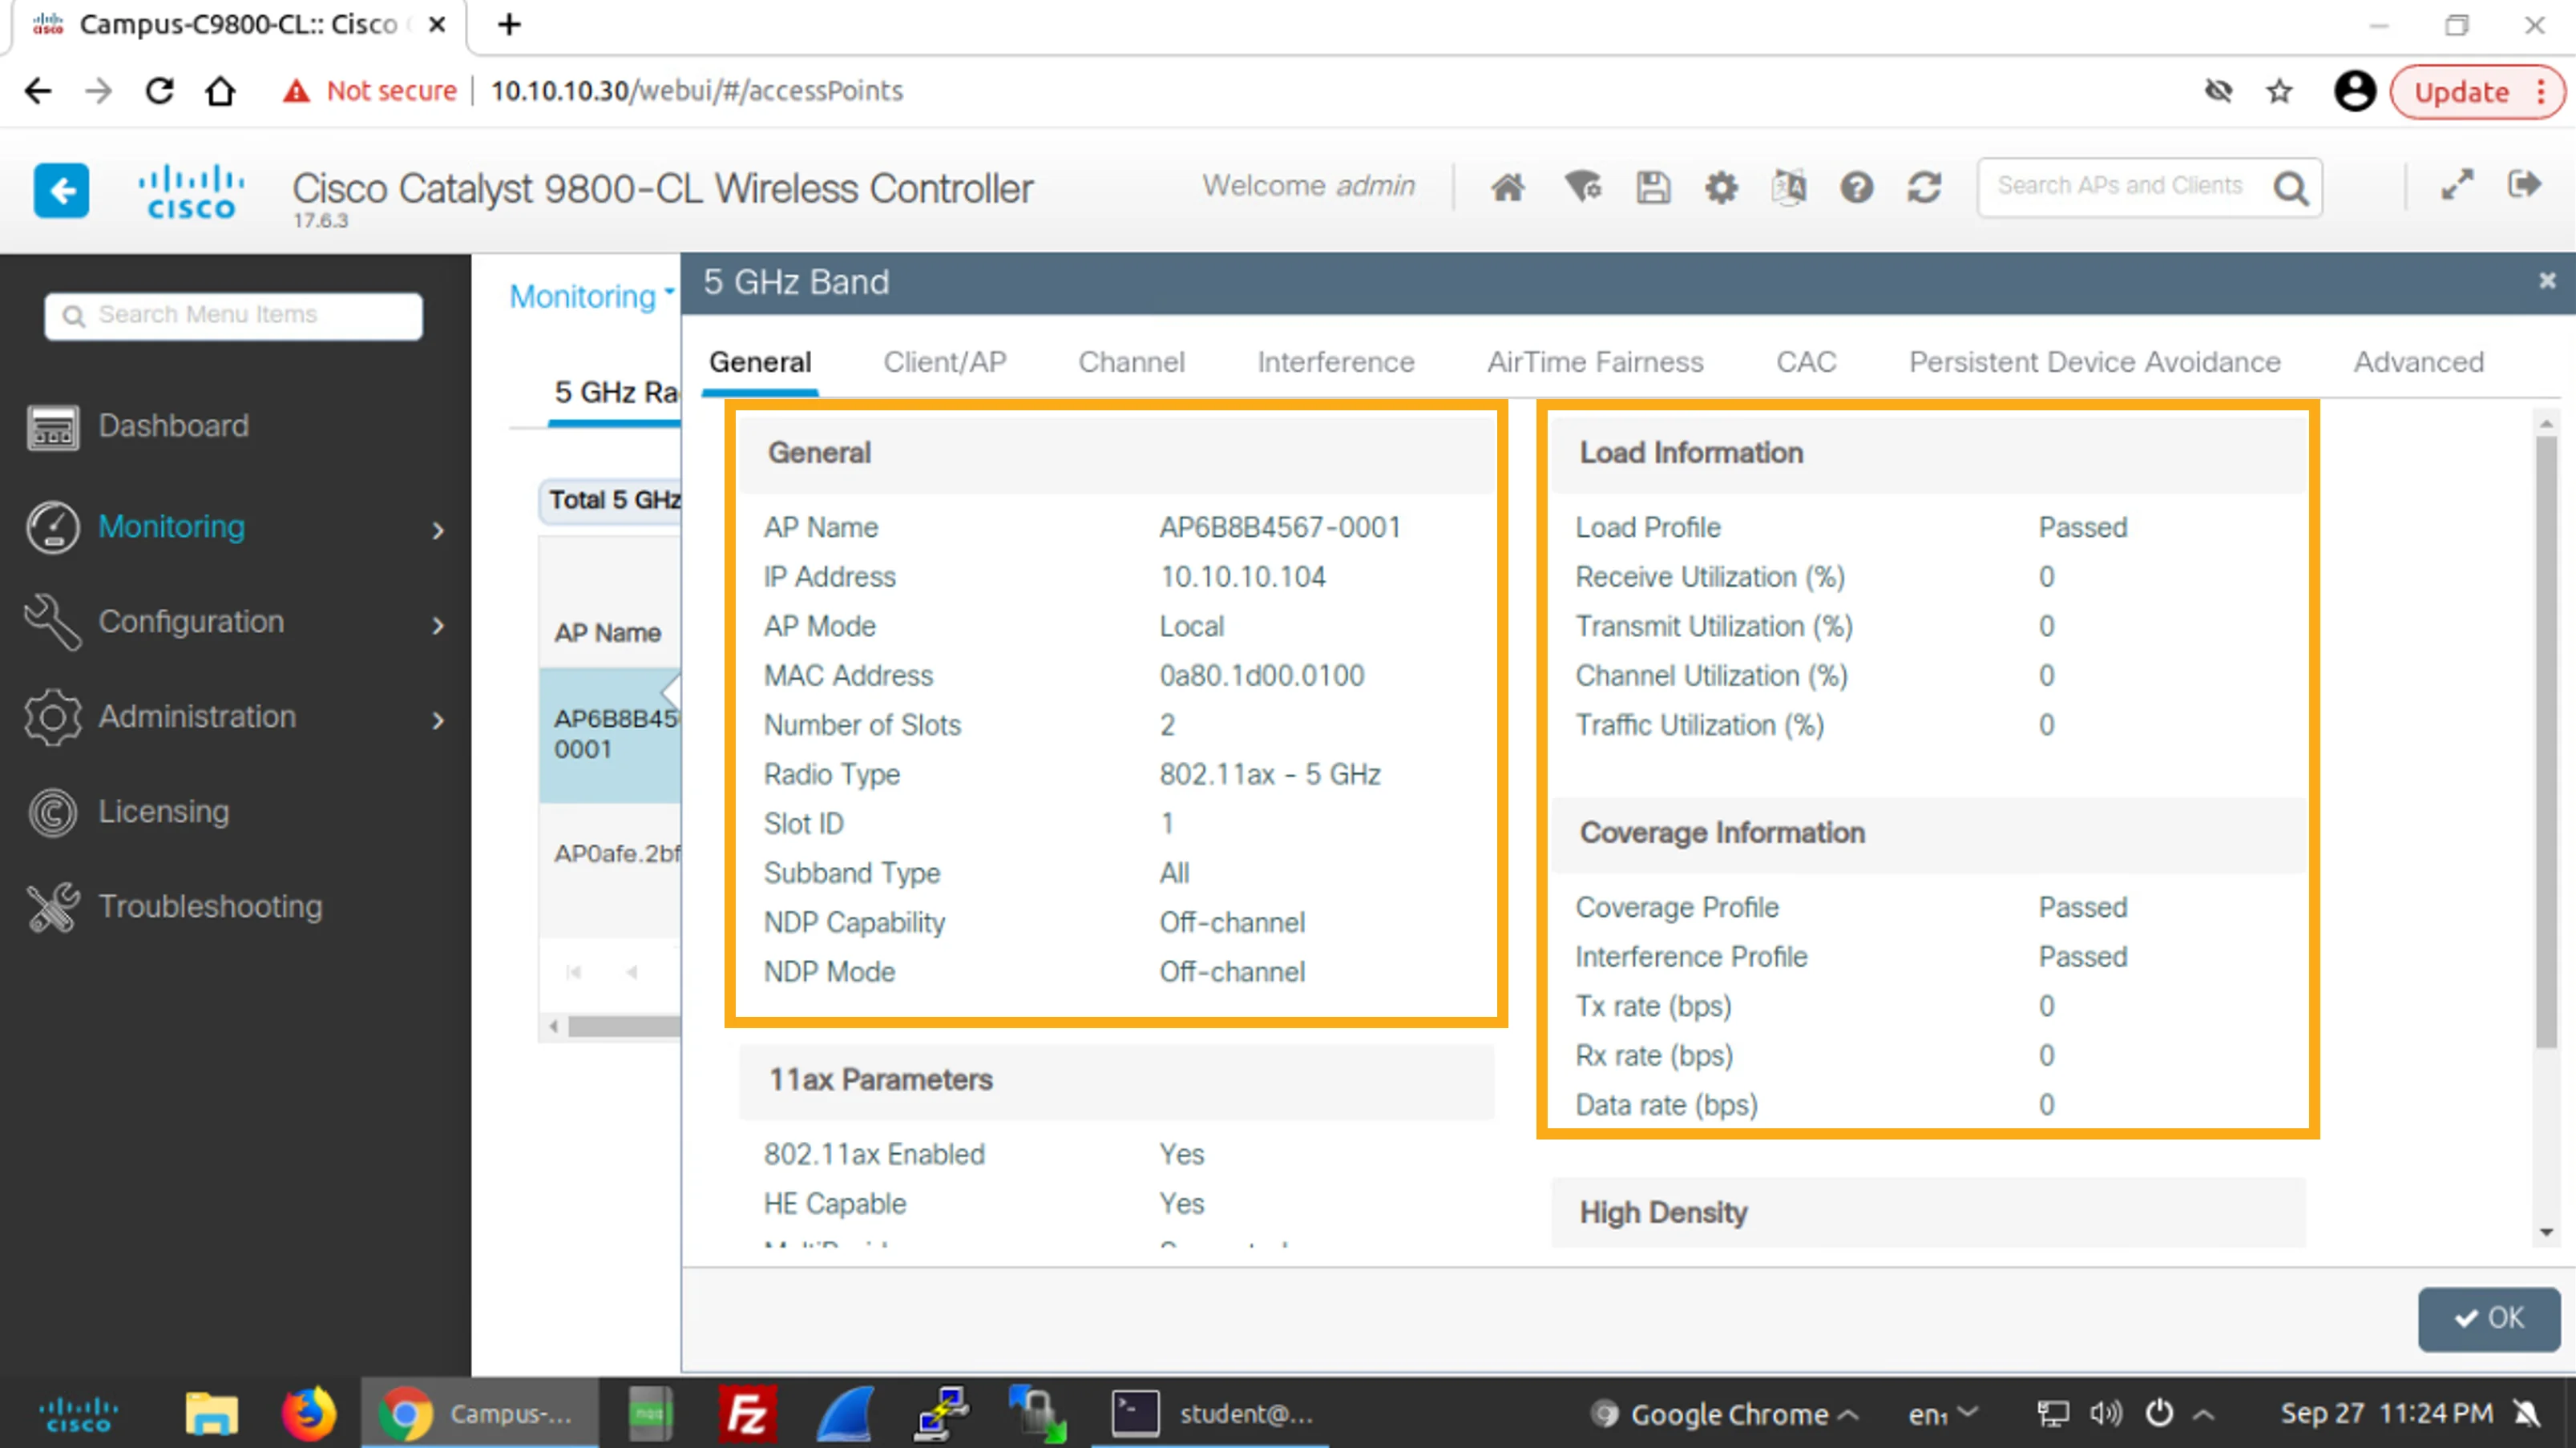
Examine the information that is provided on the General tab of the chosen AP.
檢視所選 AP 的 General 標籤頁中提供的資訊。
The upper part of the General tab includes general, load, and coverage information.
General 標籤頁的上半部包括一般資訊、負載與涵蓋範圍資訊。
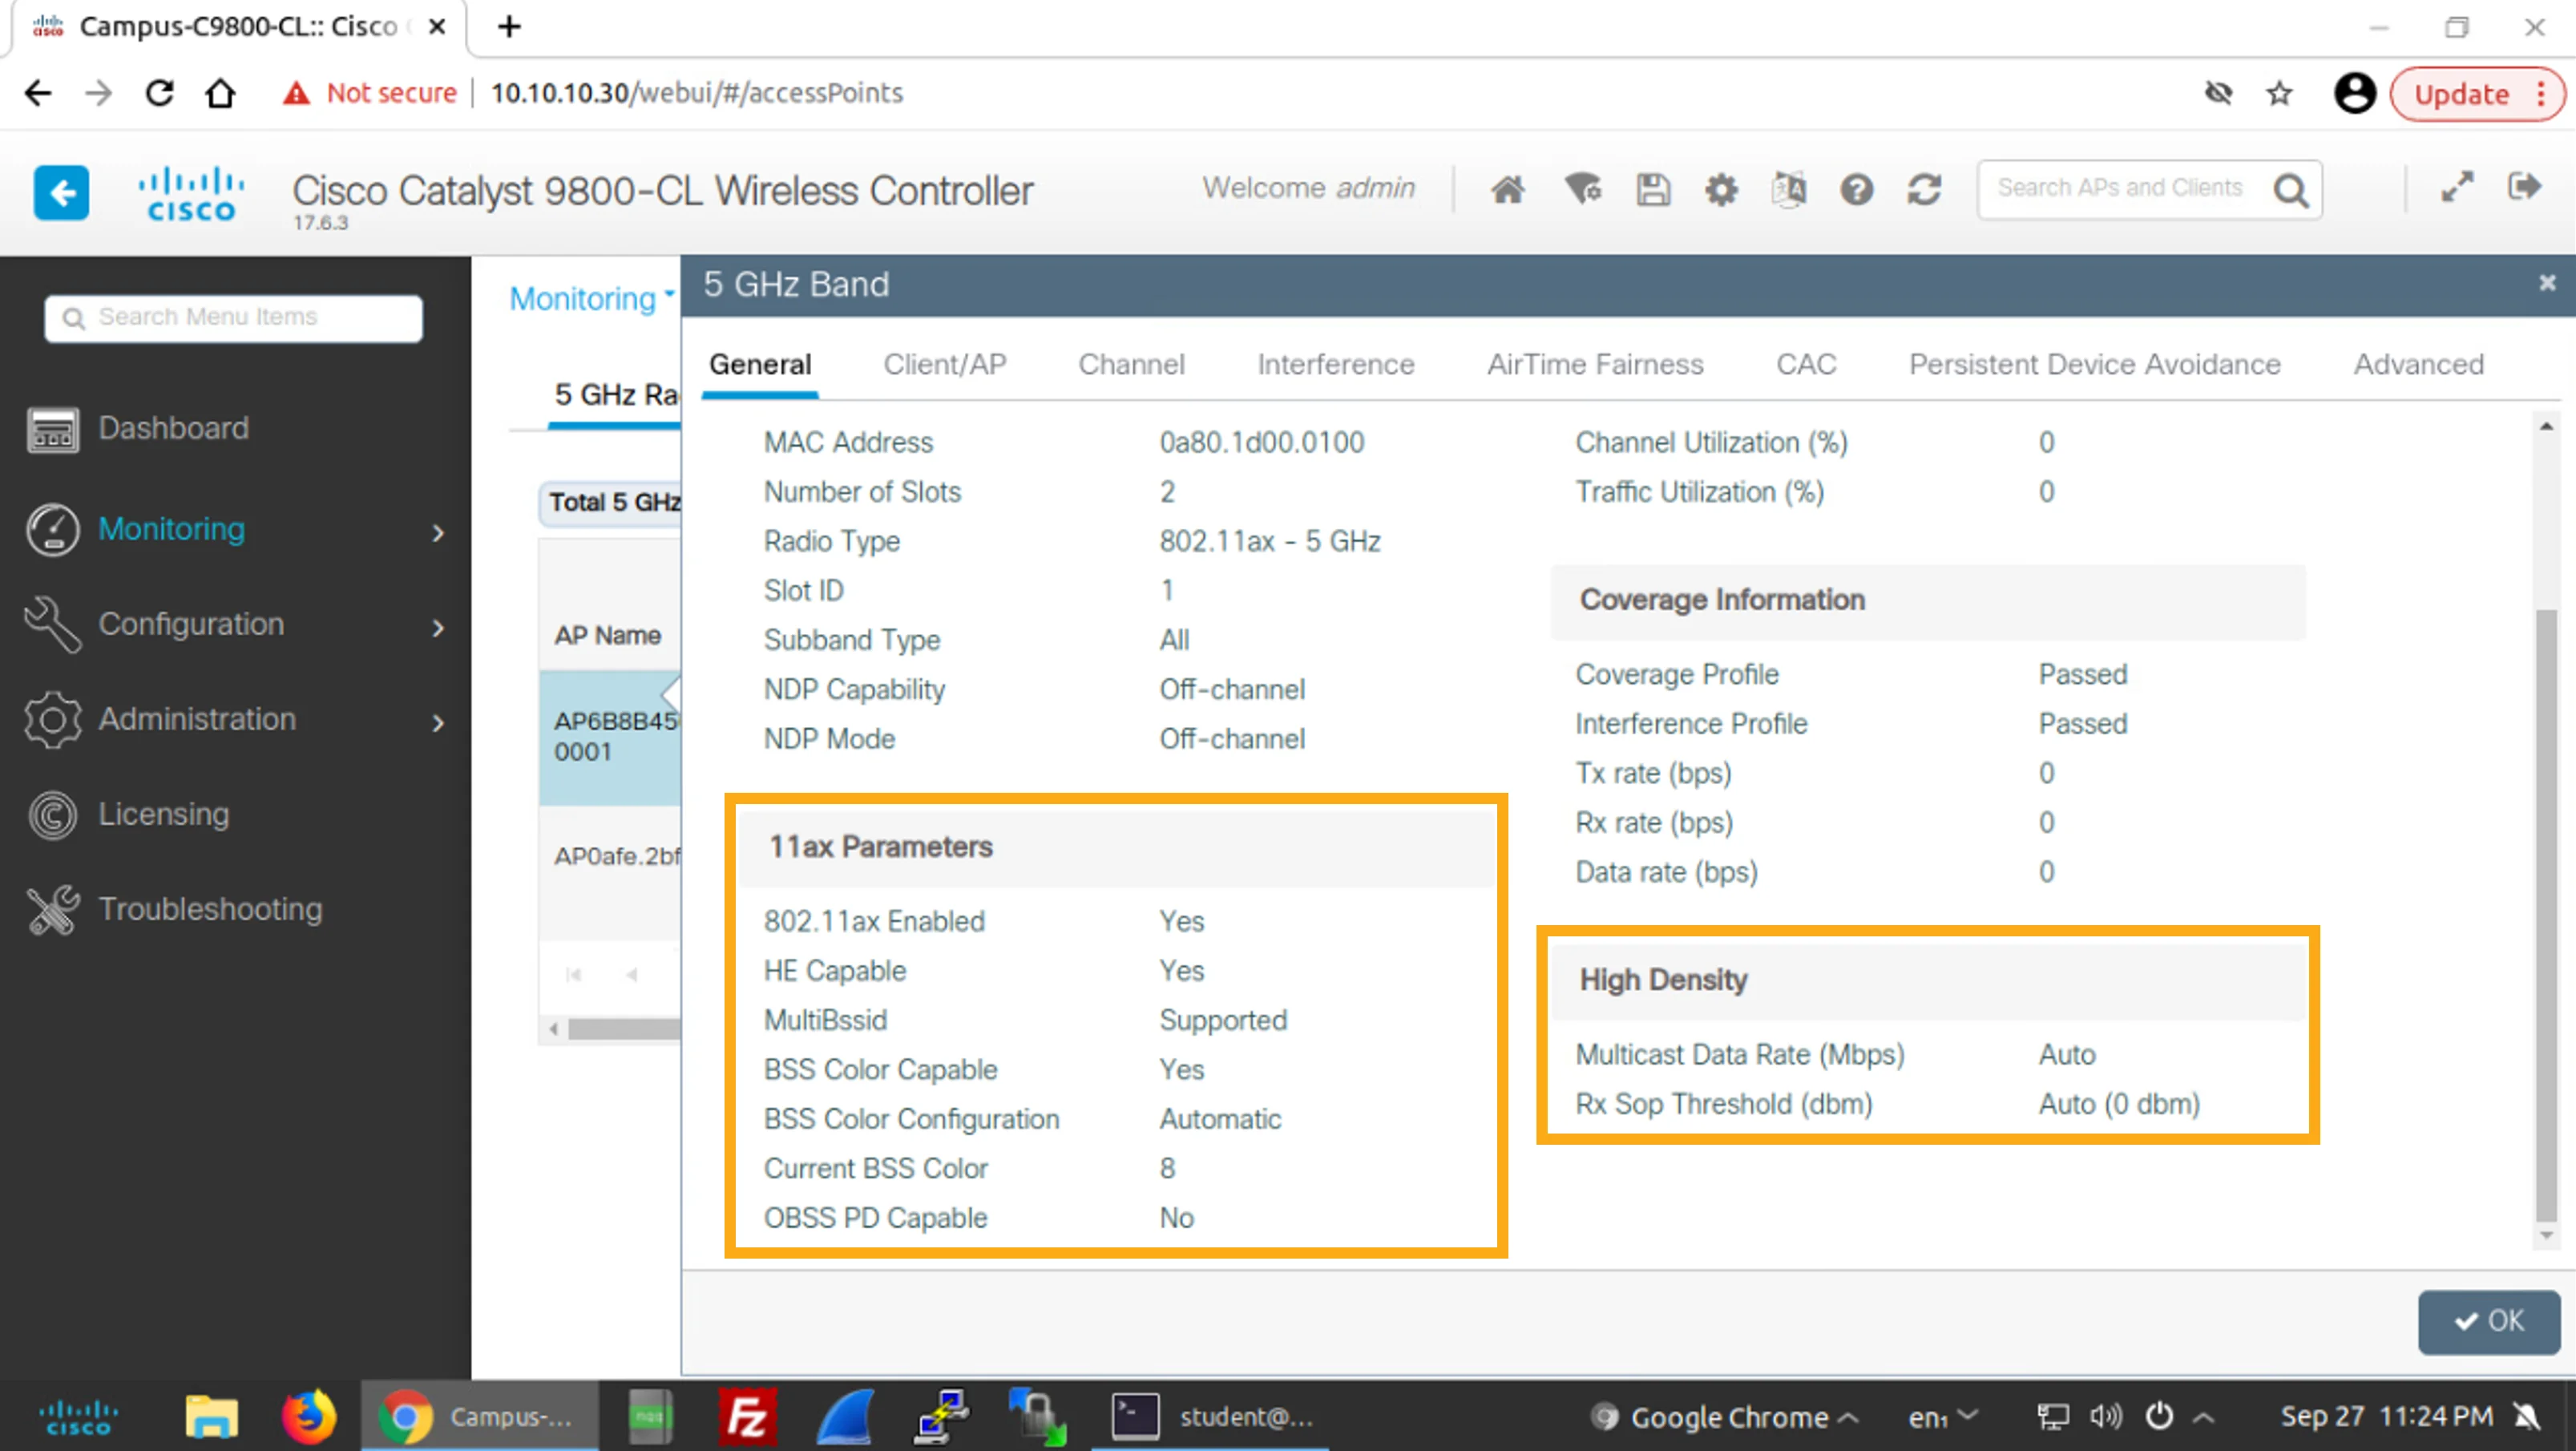
After you scroll down, you can see 11ax parameters and high-density information.
向下捲動後,你可以看到 11ax 參數與高密度資訊。
The following information is provided in the upper part of the General tab.
General 標籤頁上半部所提供的資訊如下。
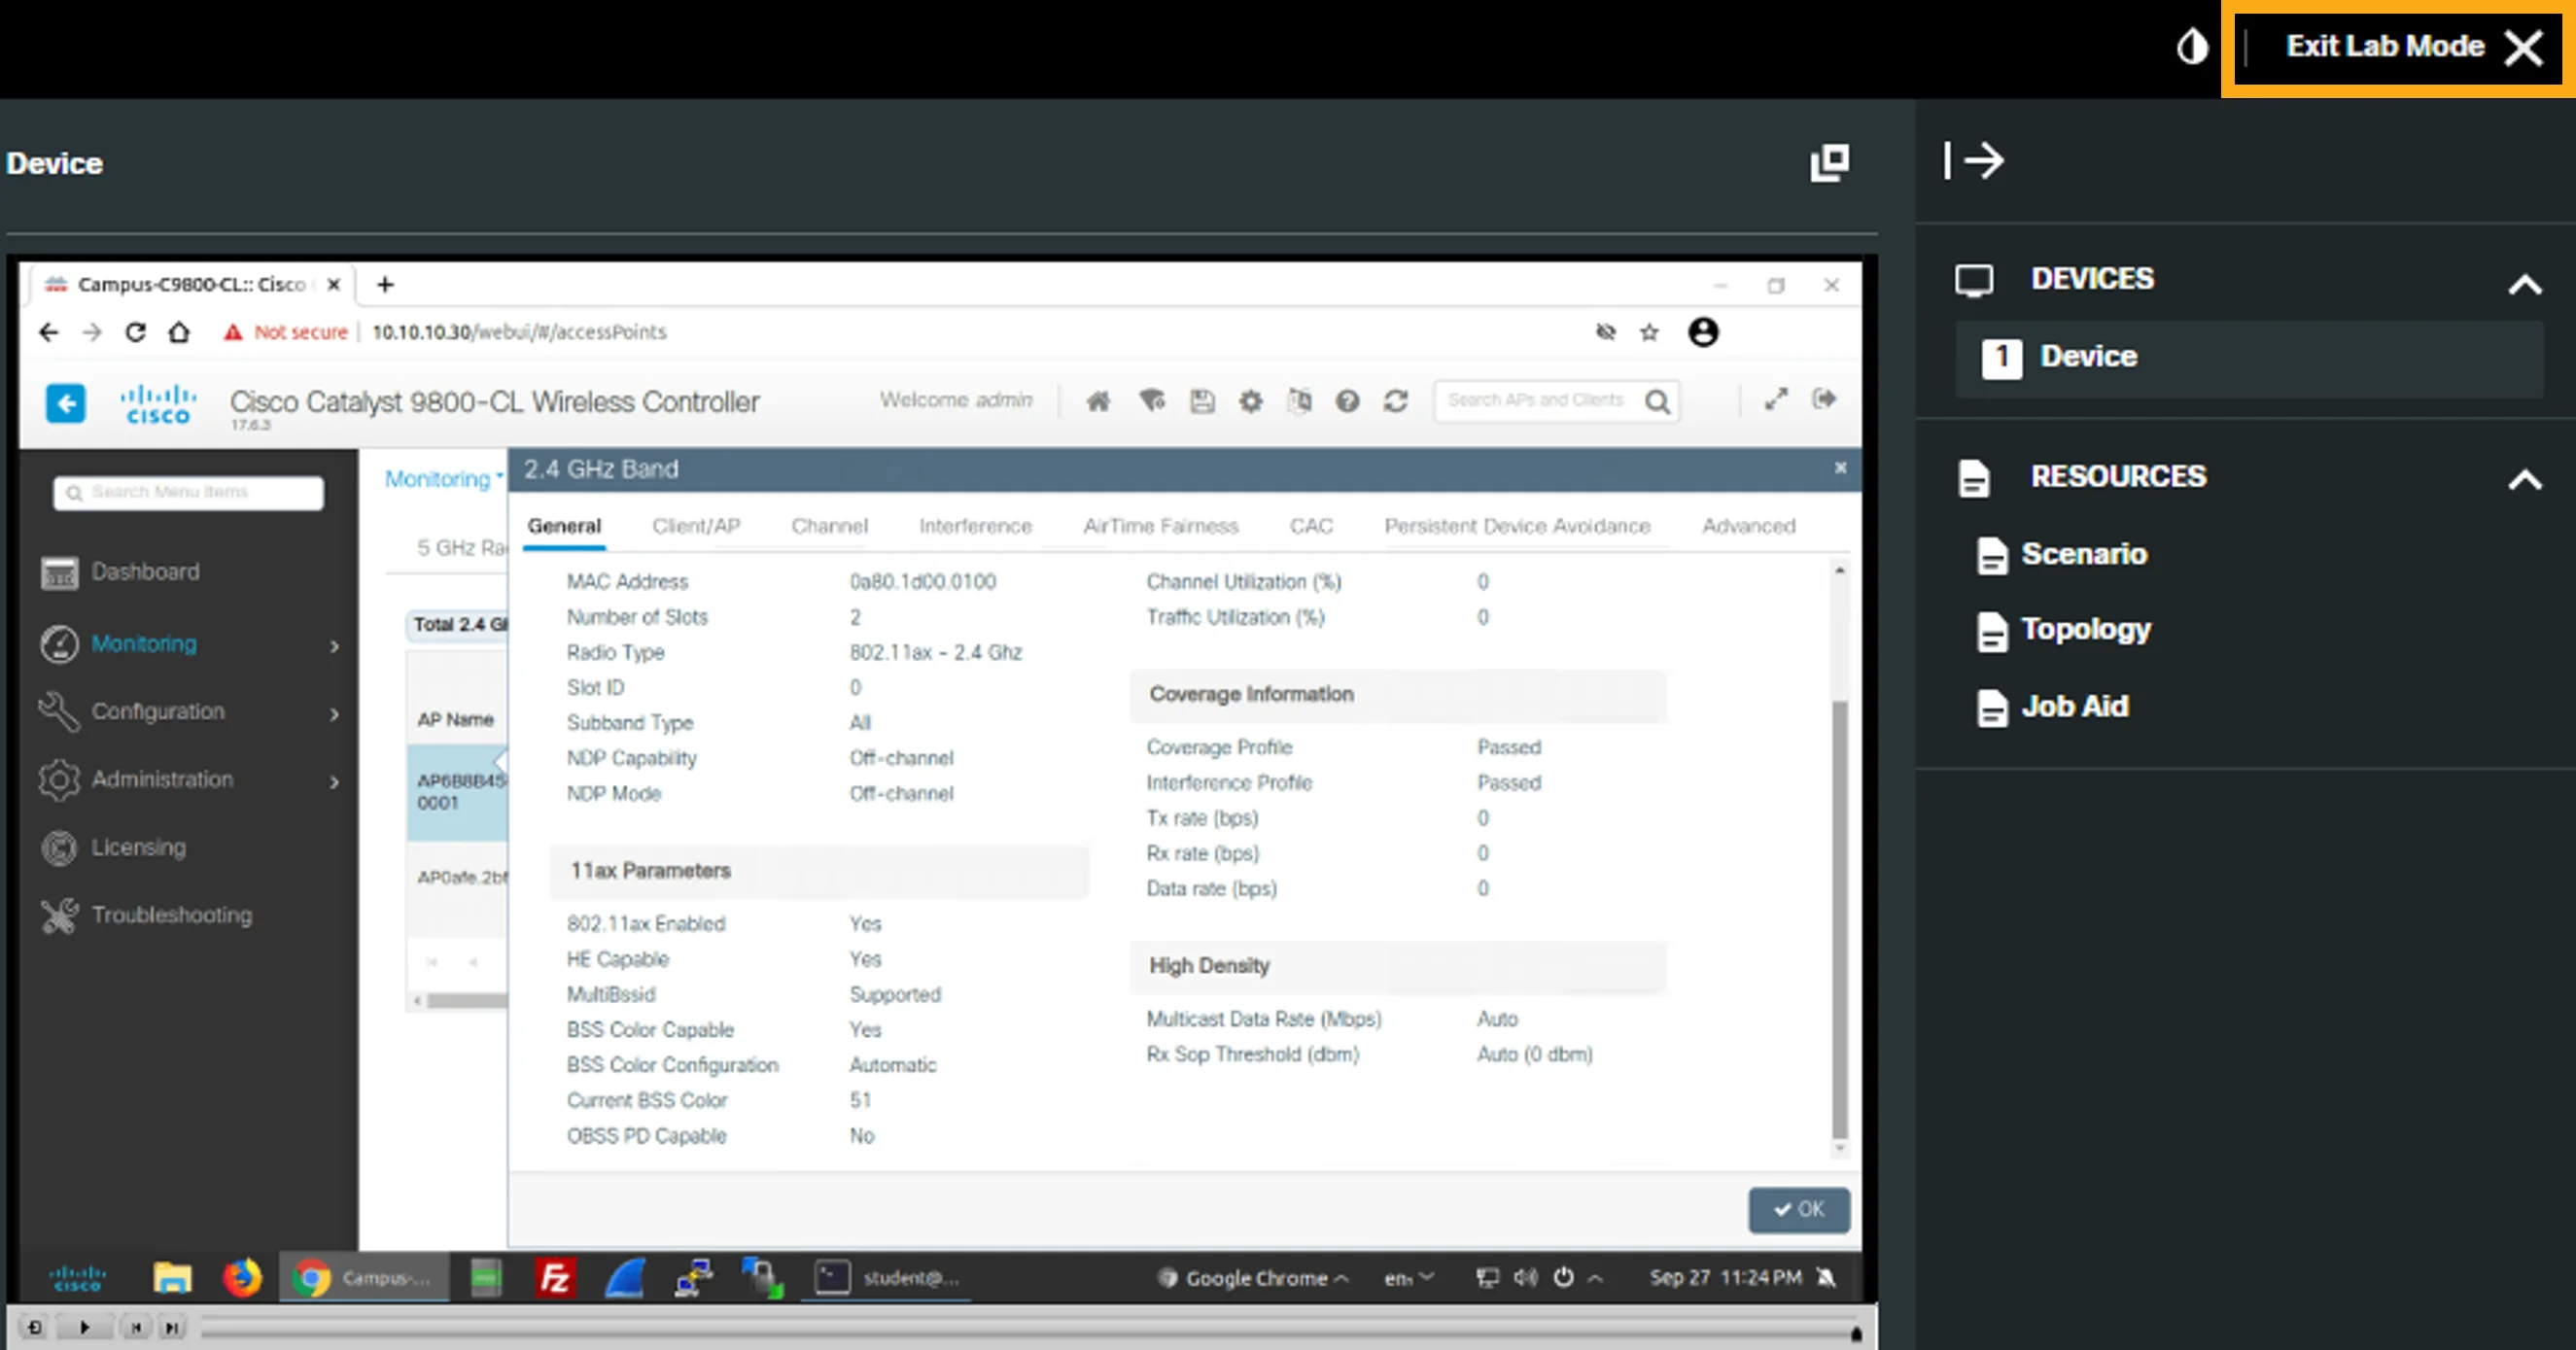
These 11ax parameters and the high density information are shown on the General tab.
這些 11ax 參數與高密度資訊顯示於 General 標籤頁。
Click OK at the bottom right or the X at the top-right corner of the window that shows the general radio statistics to close the window.
點按右下角的 OK,或點按顯示一般無線電統計資料視窗右上角的 X,關閉視窗。
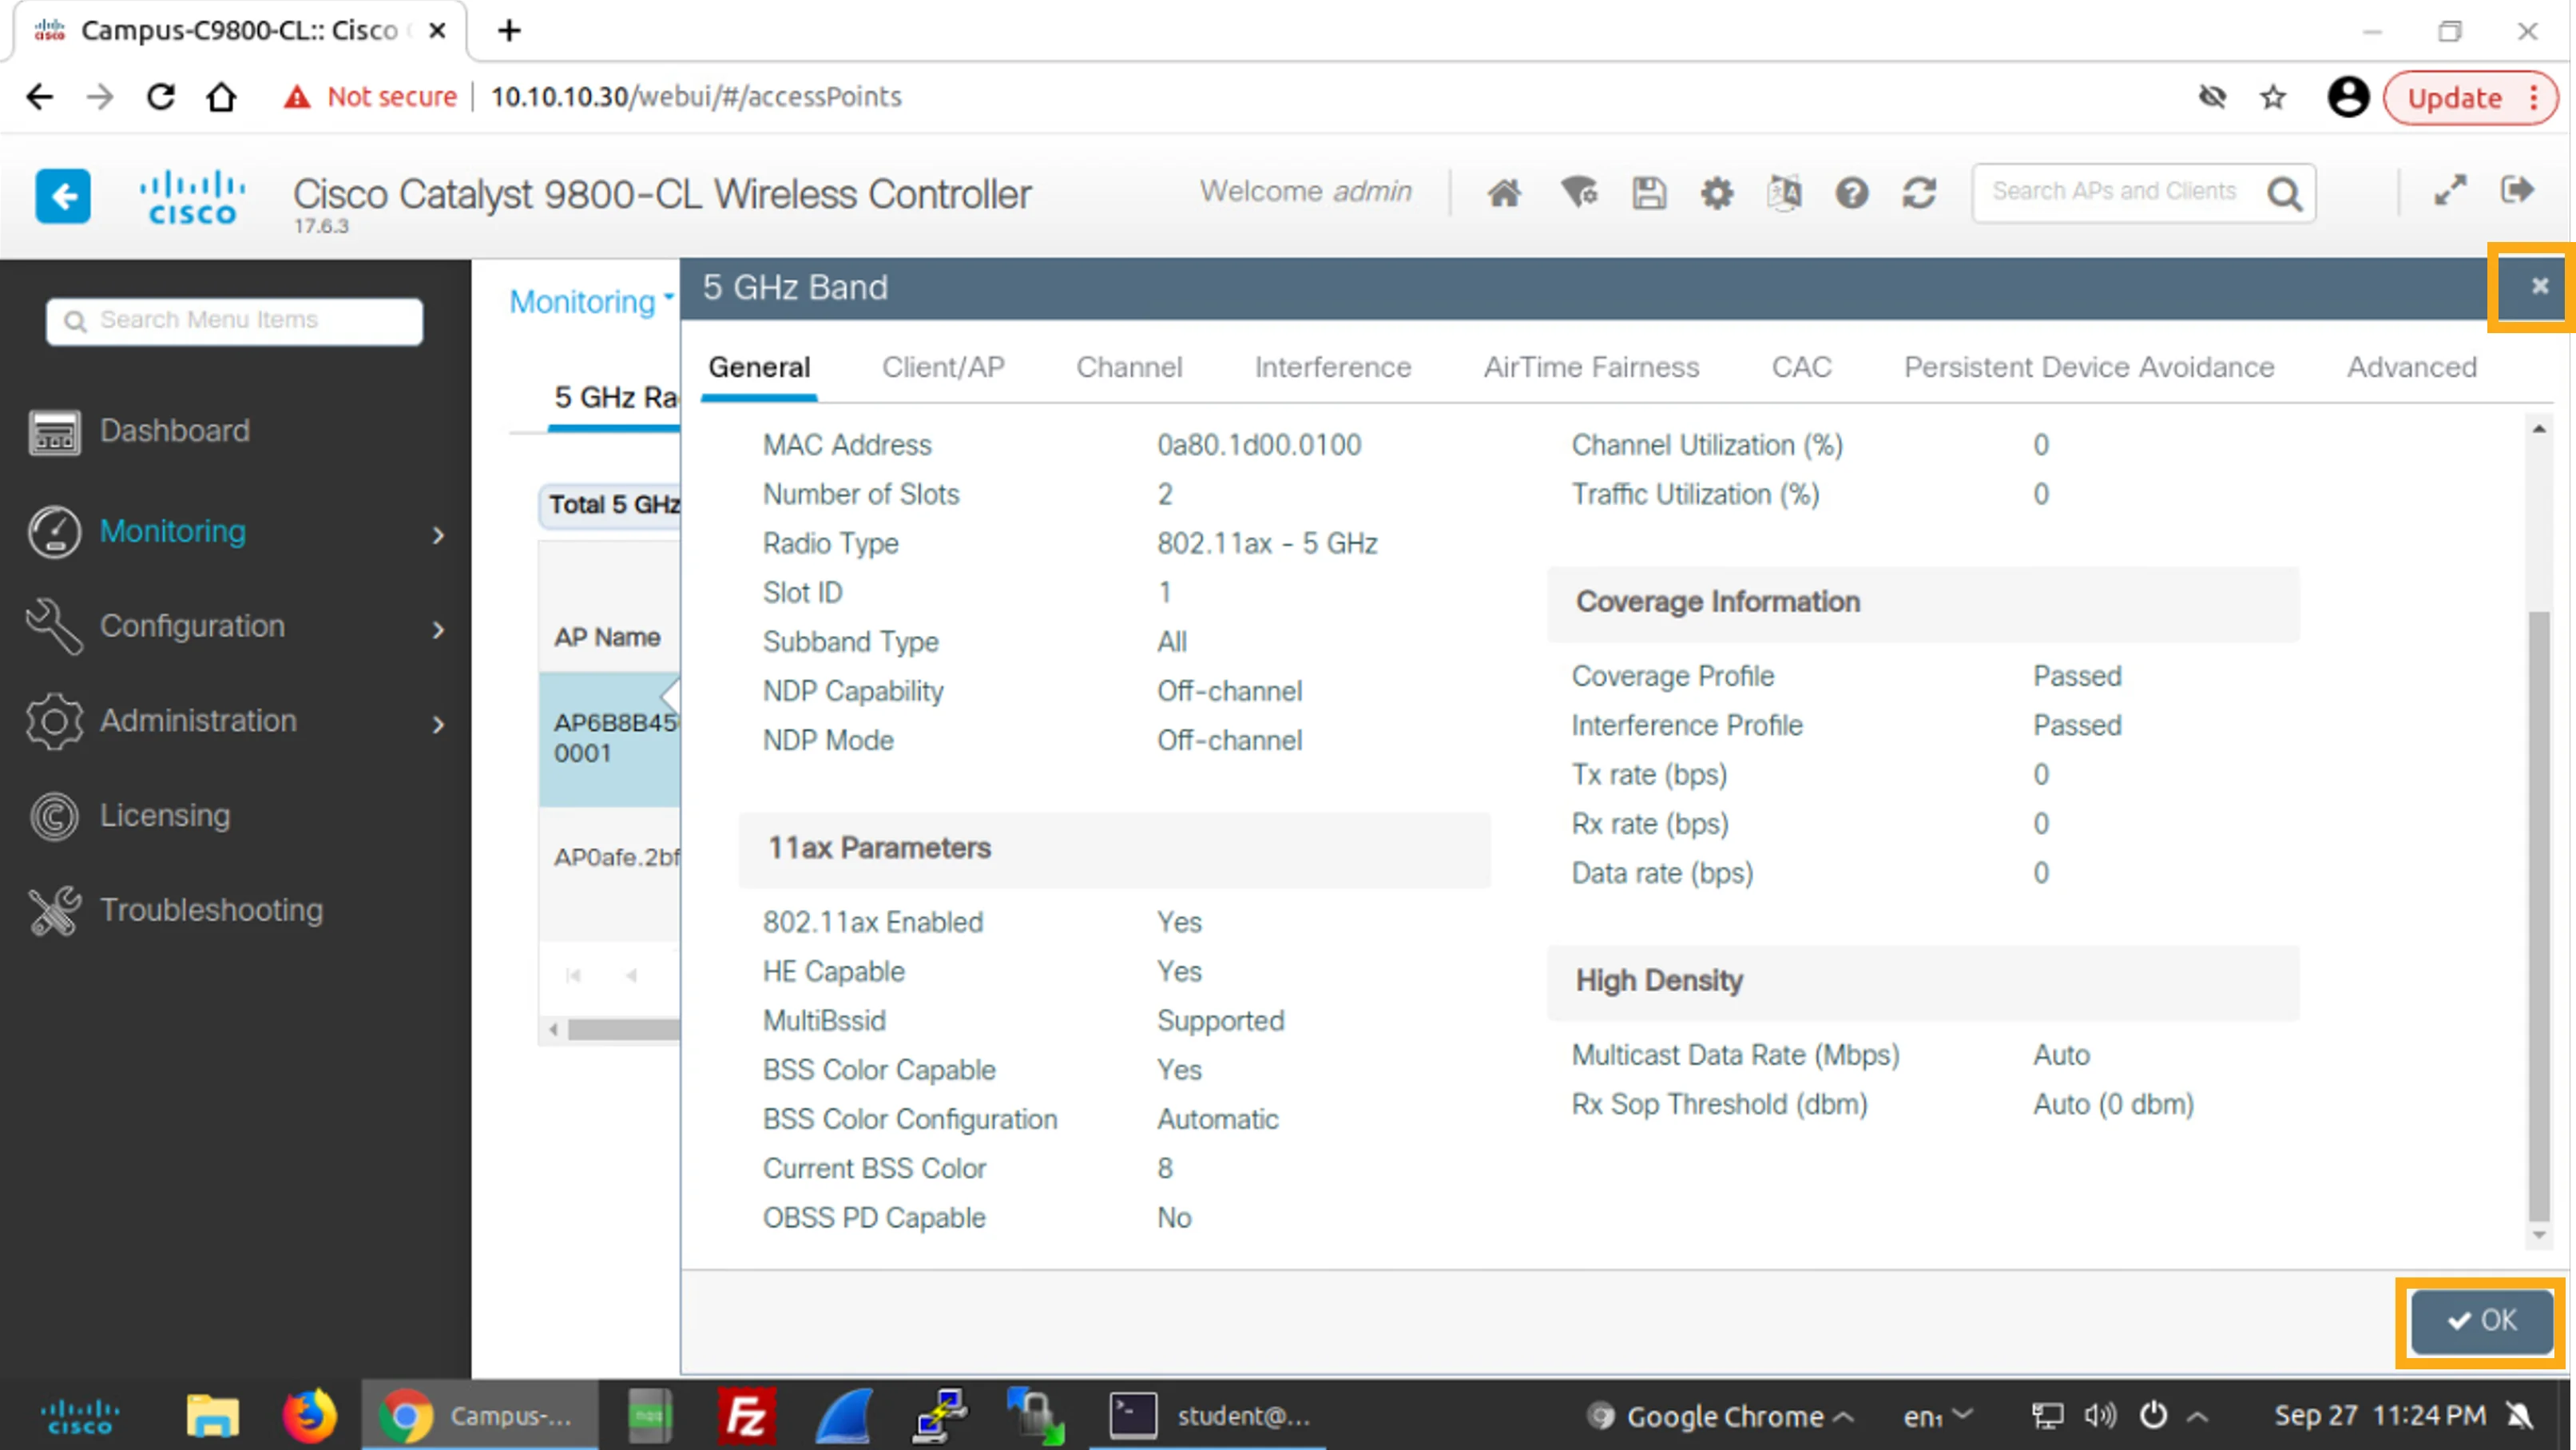
Click 2.4 GHz Radios to change to the Radio Statistics page that shows the list of 2.4-GHz APs.
點按 2.4 GHz Radios,切換至顯示 2.4 GHz AP 清單的 Radio Statistics 頁面。
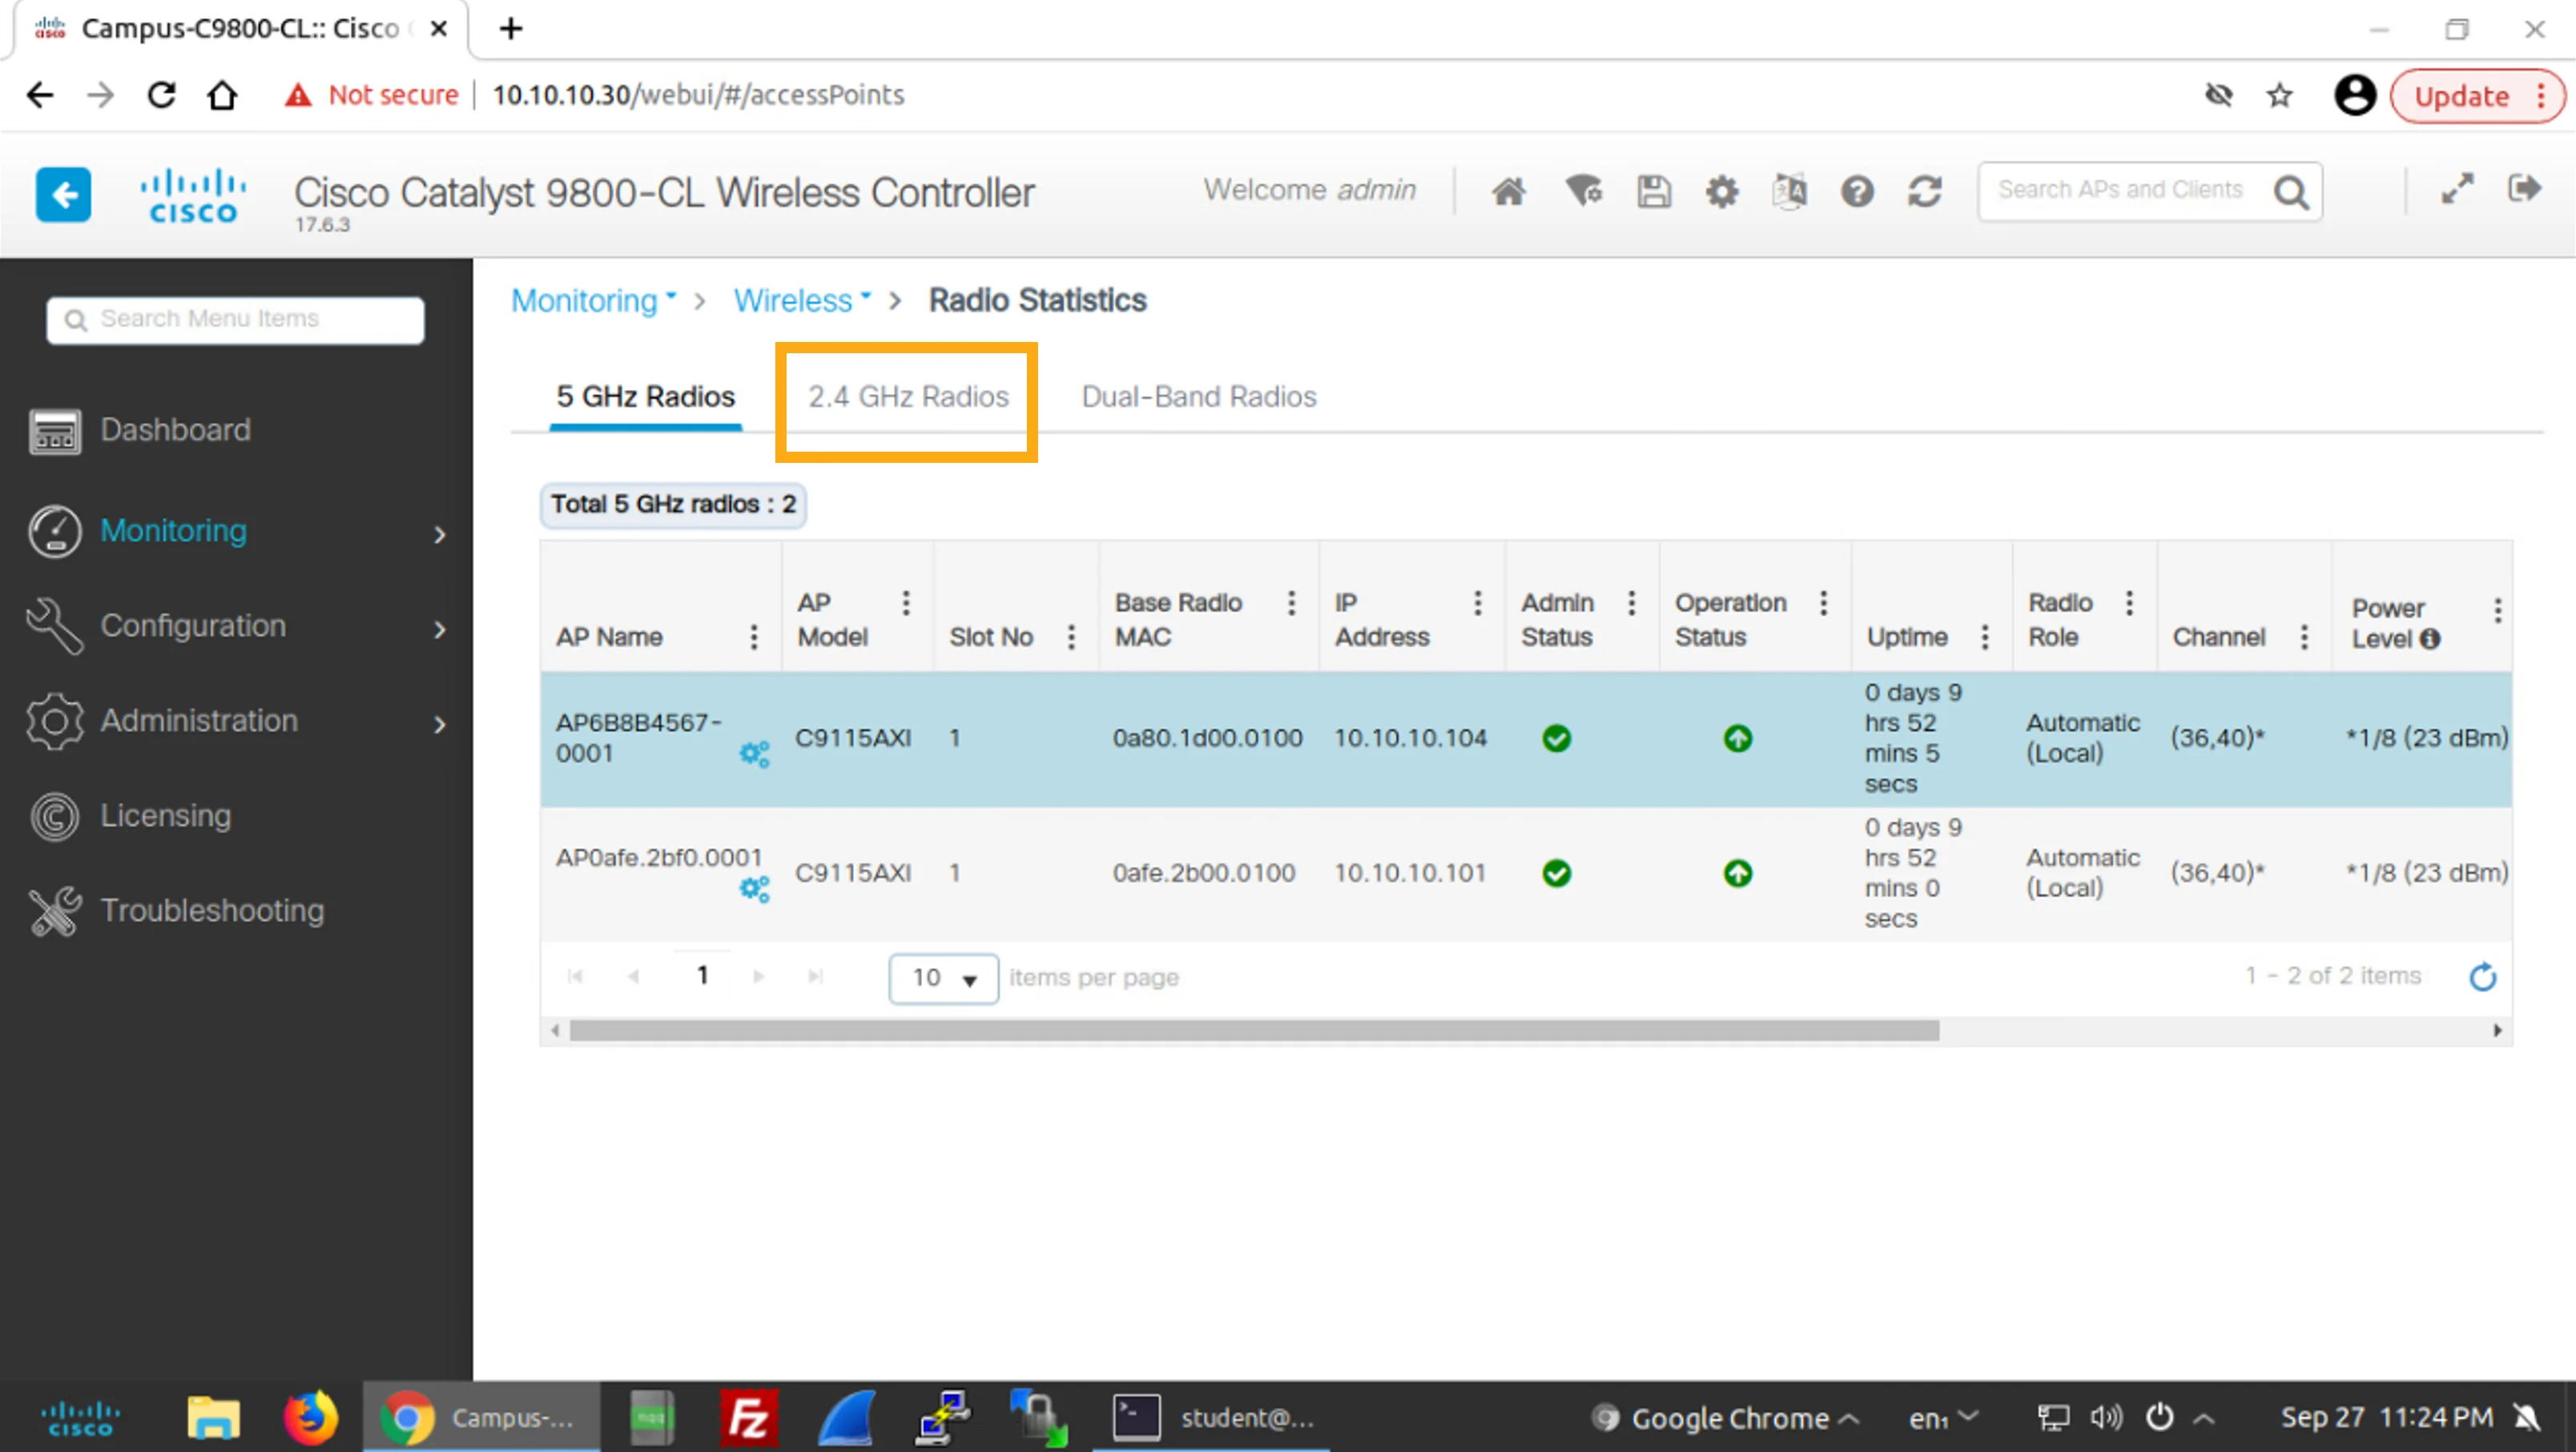
Observe the list of APs in the 2.4 GHz Radios tab and examine the information that is provided in the list.
觀察 2.4 GHz Radios 標籤頁中的 AP 清單,並檢視清單中提供的資訊。
Just like the list of 5-GHz APs, the list includes the AP name, model, its IP and MAC addresses, administrative and operational status, uptime, and information about the channels and the power level.
與 5 GHz AP 清單相同,此清單也包括 AP 名稱、機型、IP 與 MAC 位址、管理狀態與運作狀態、運作時間,以及頻道與功率等級的相關資訊。
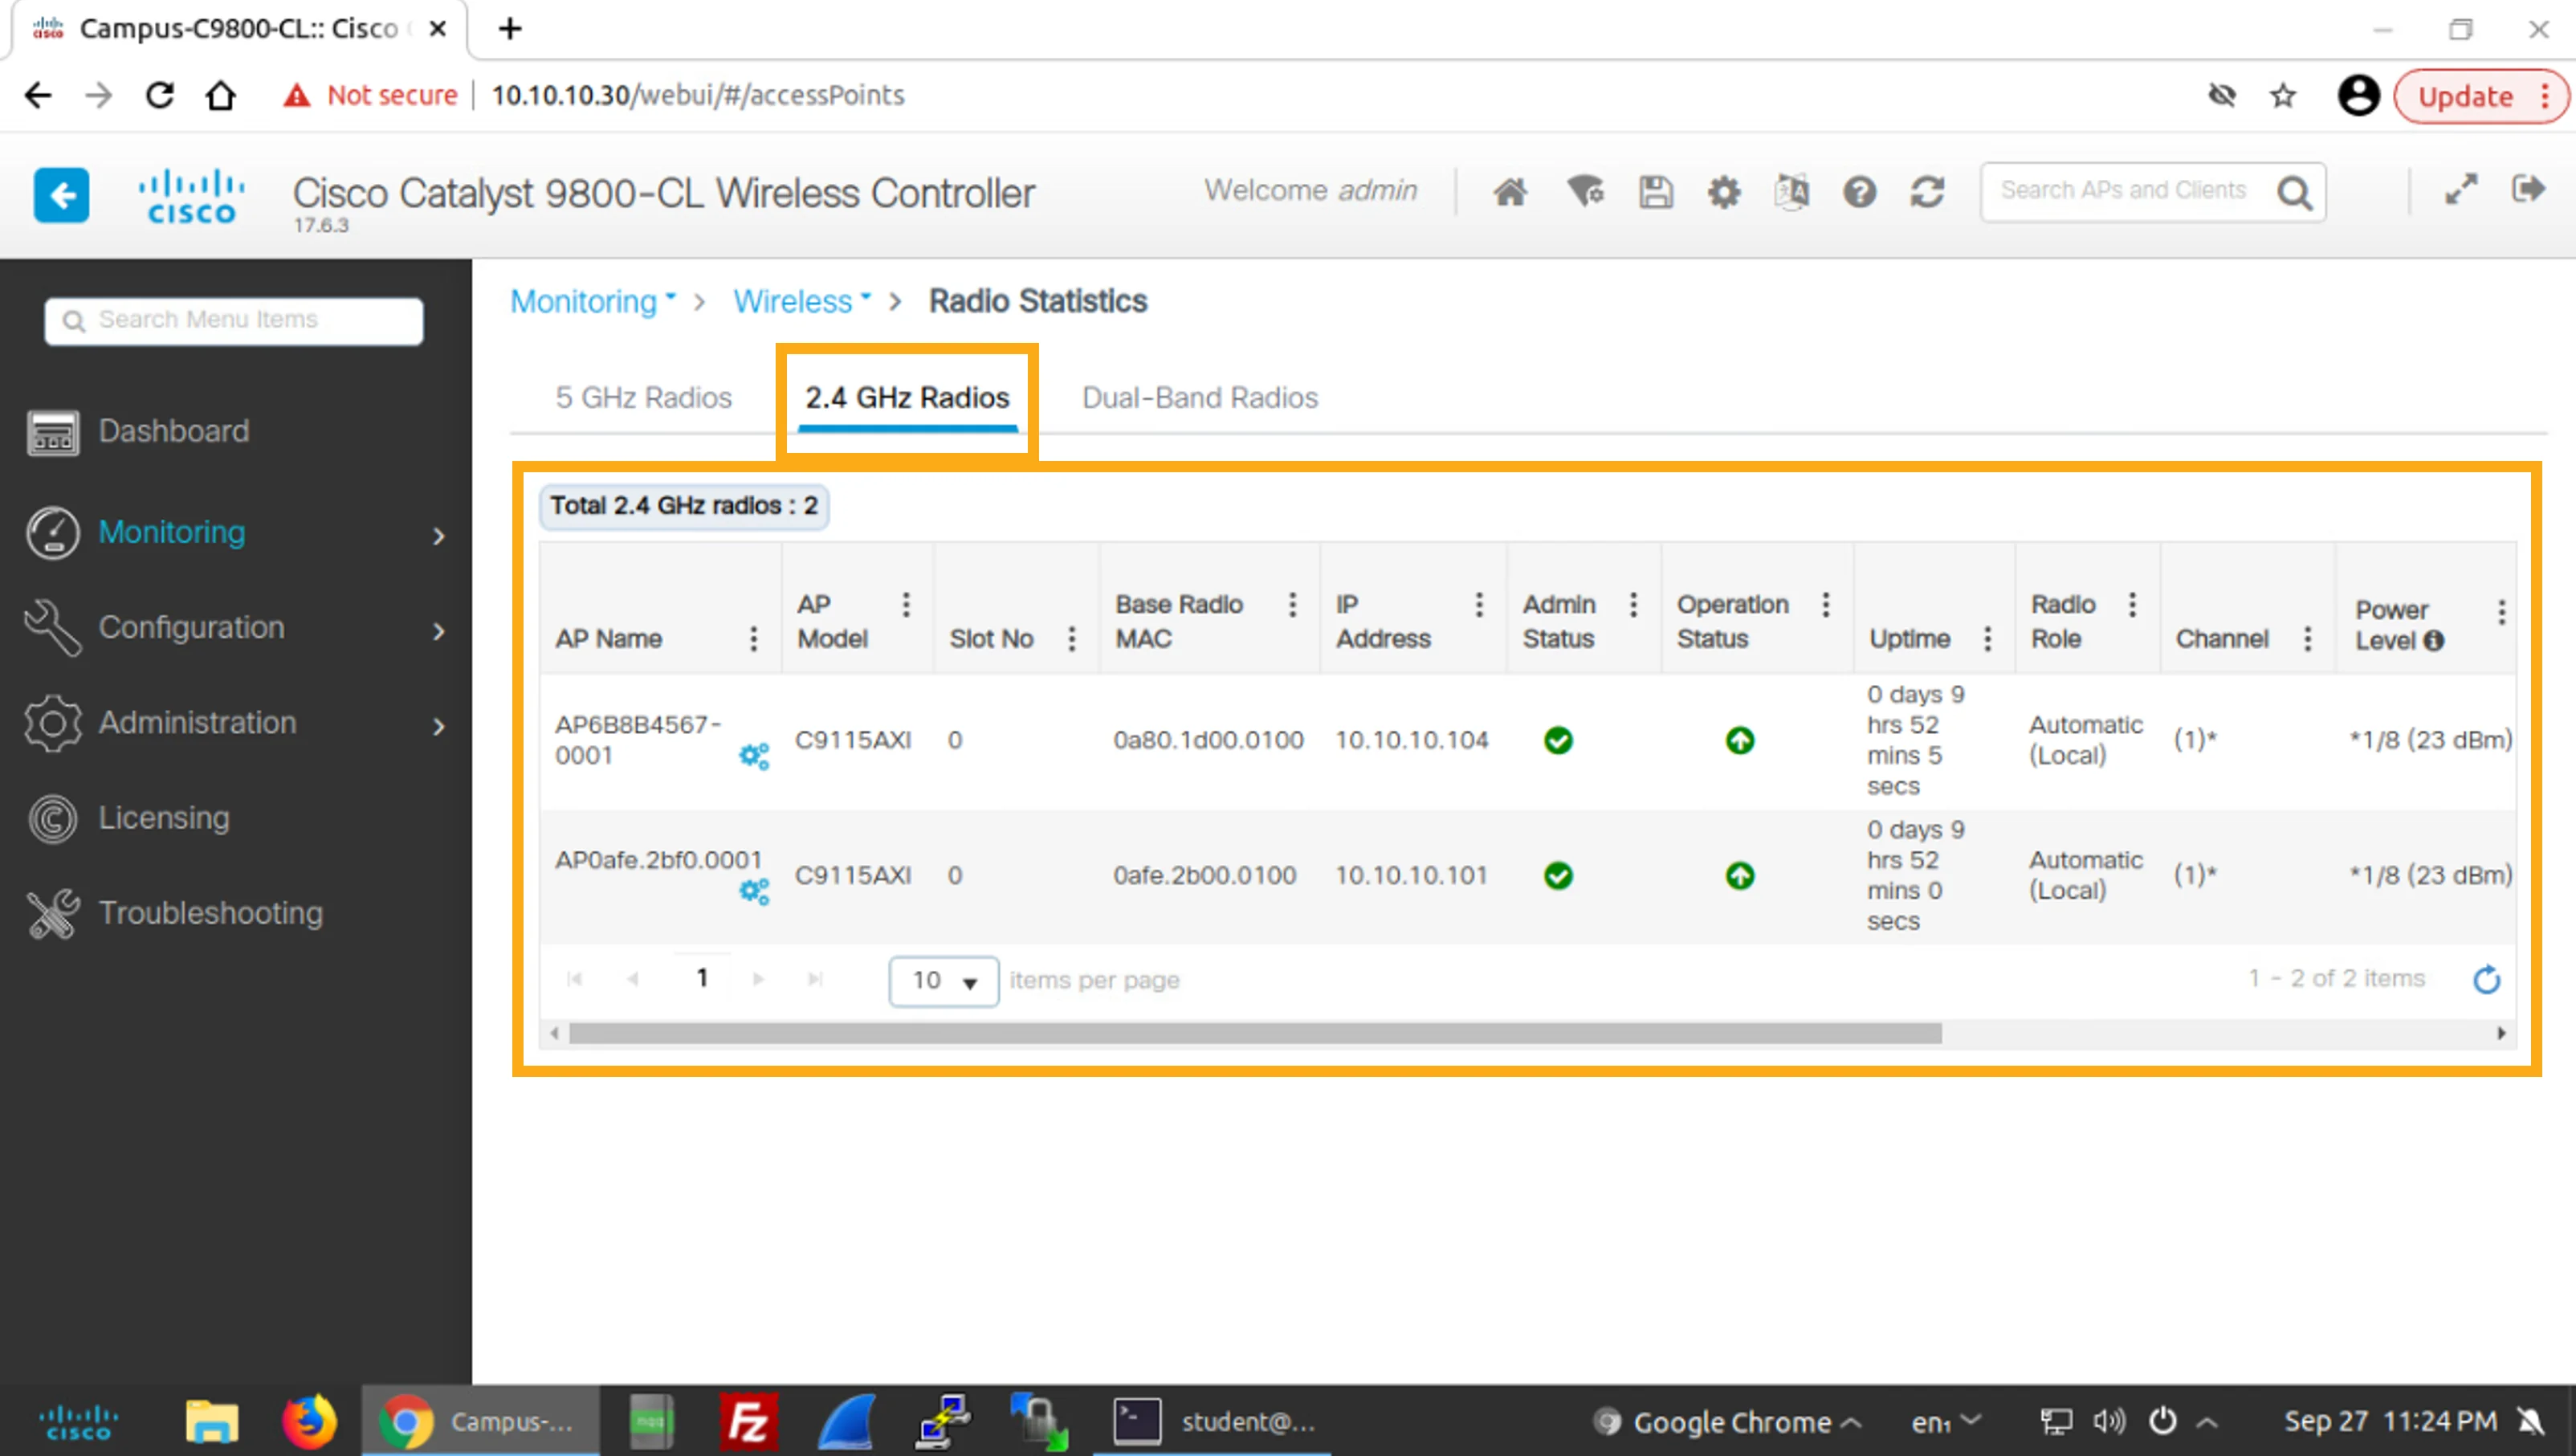
Click the first AP in the list (AP6B8B4567-0001) to display even more details about the AP.
點按清單中的第一個 AP(AP6B8B4567-0001),顯示該 AP 更多的詳細資料。
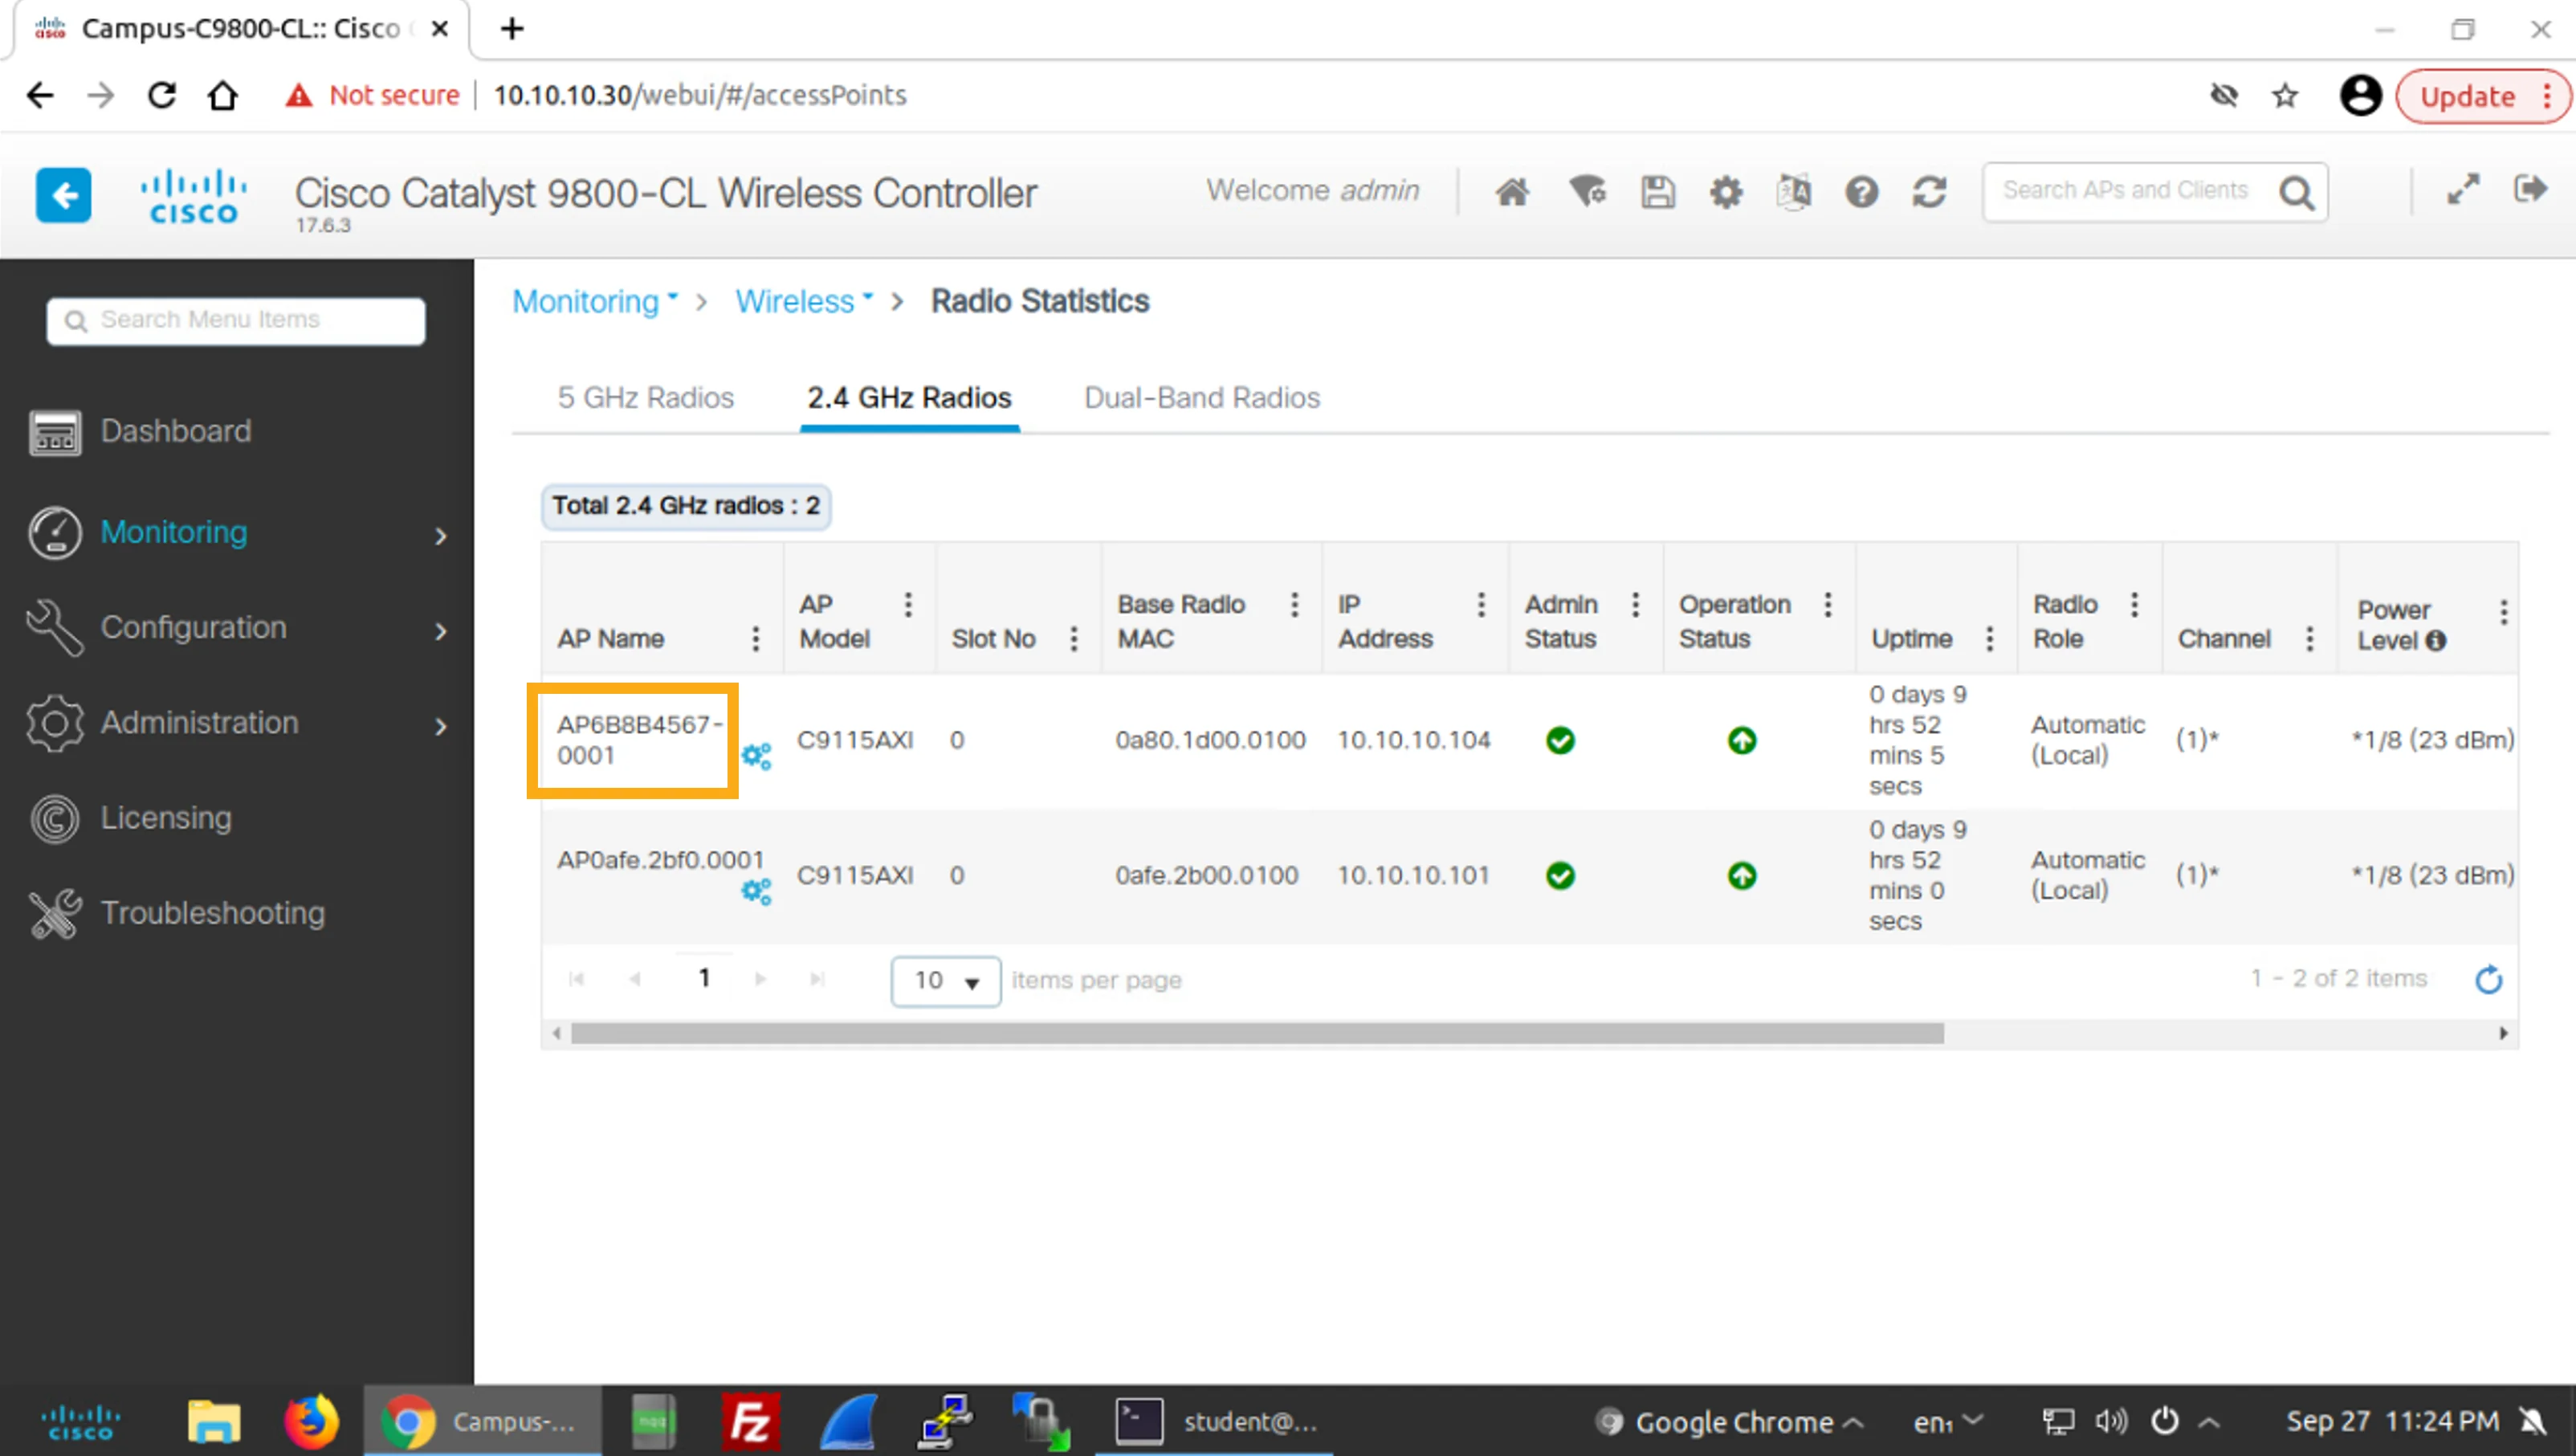
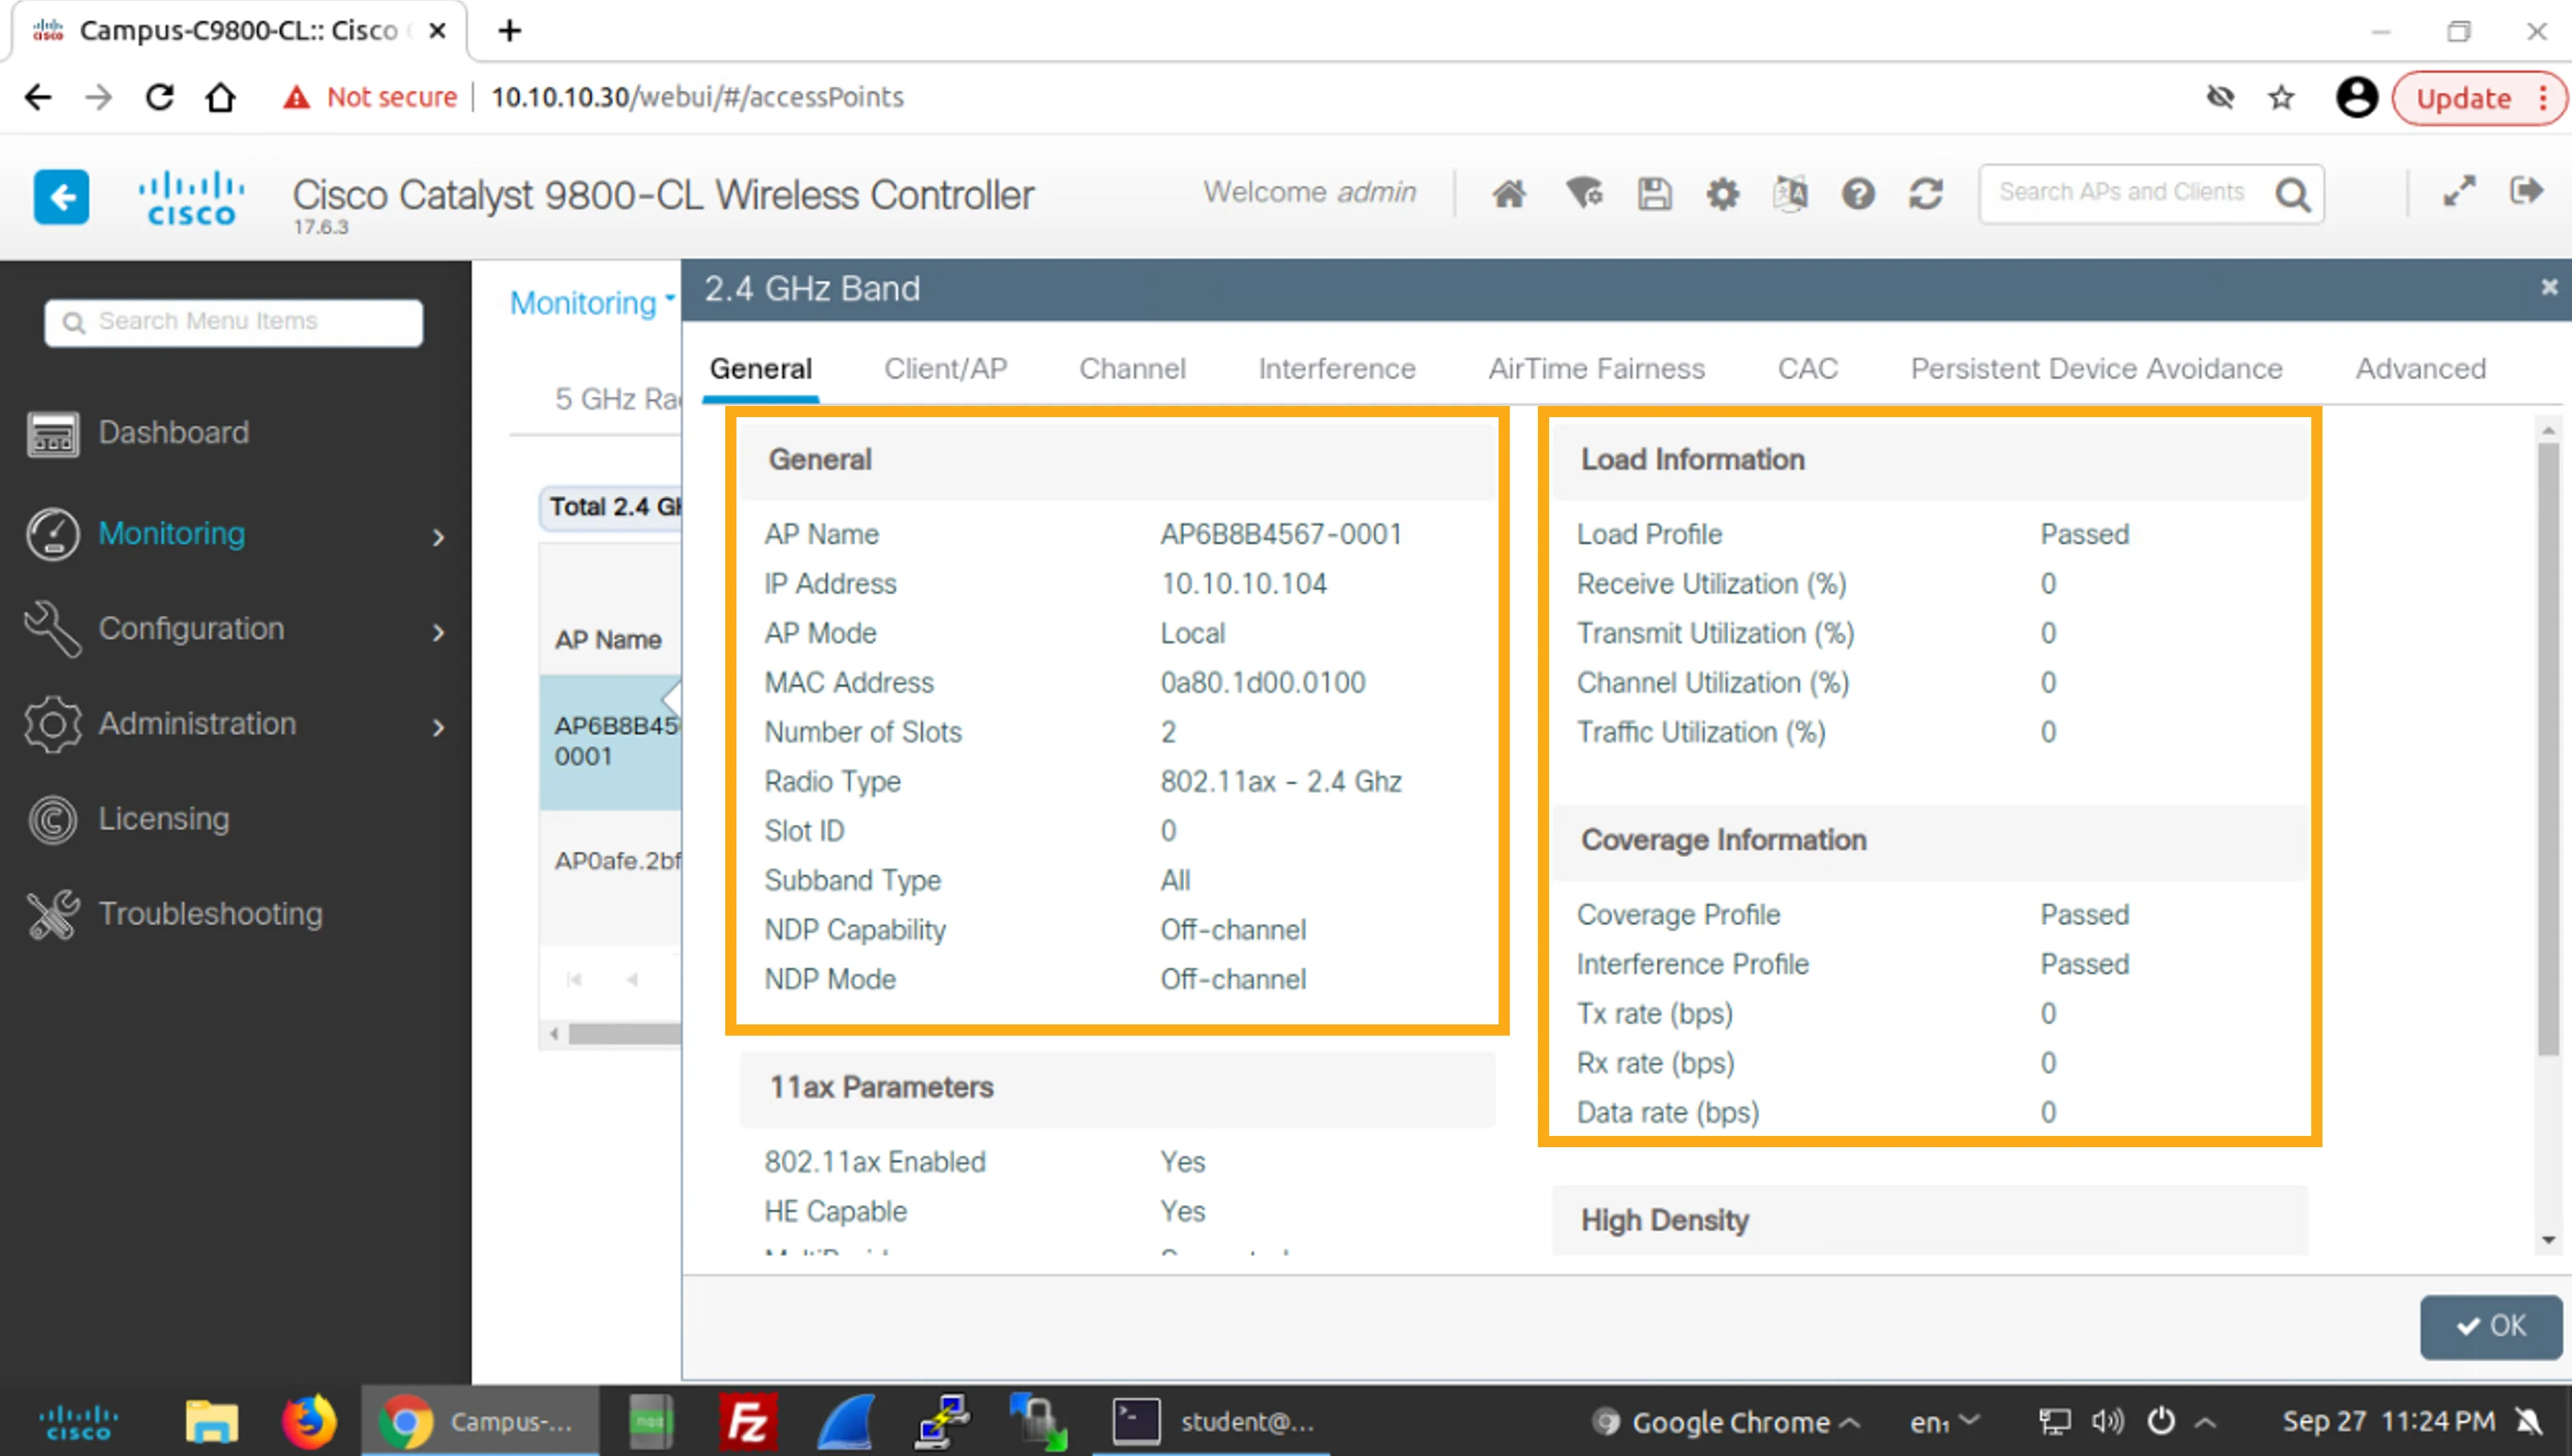
Examine the information that is provided in the General tab of the chosen AP.
檢視所選 AP 的 General 標籤頁中提供的資訊。
The information that is provided is identical to the information that was shown for the 5-GHz APs. The upper part of the General tab includes general, load, and coverage information.
所提供的資訊與 5 GHz AP 所顯示的資訊相同。General 標籤頁的上半部包括一般資訊、負載與涵蓋範圍資訊。
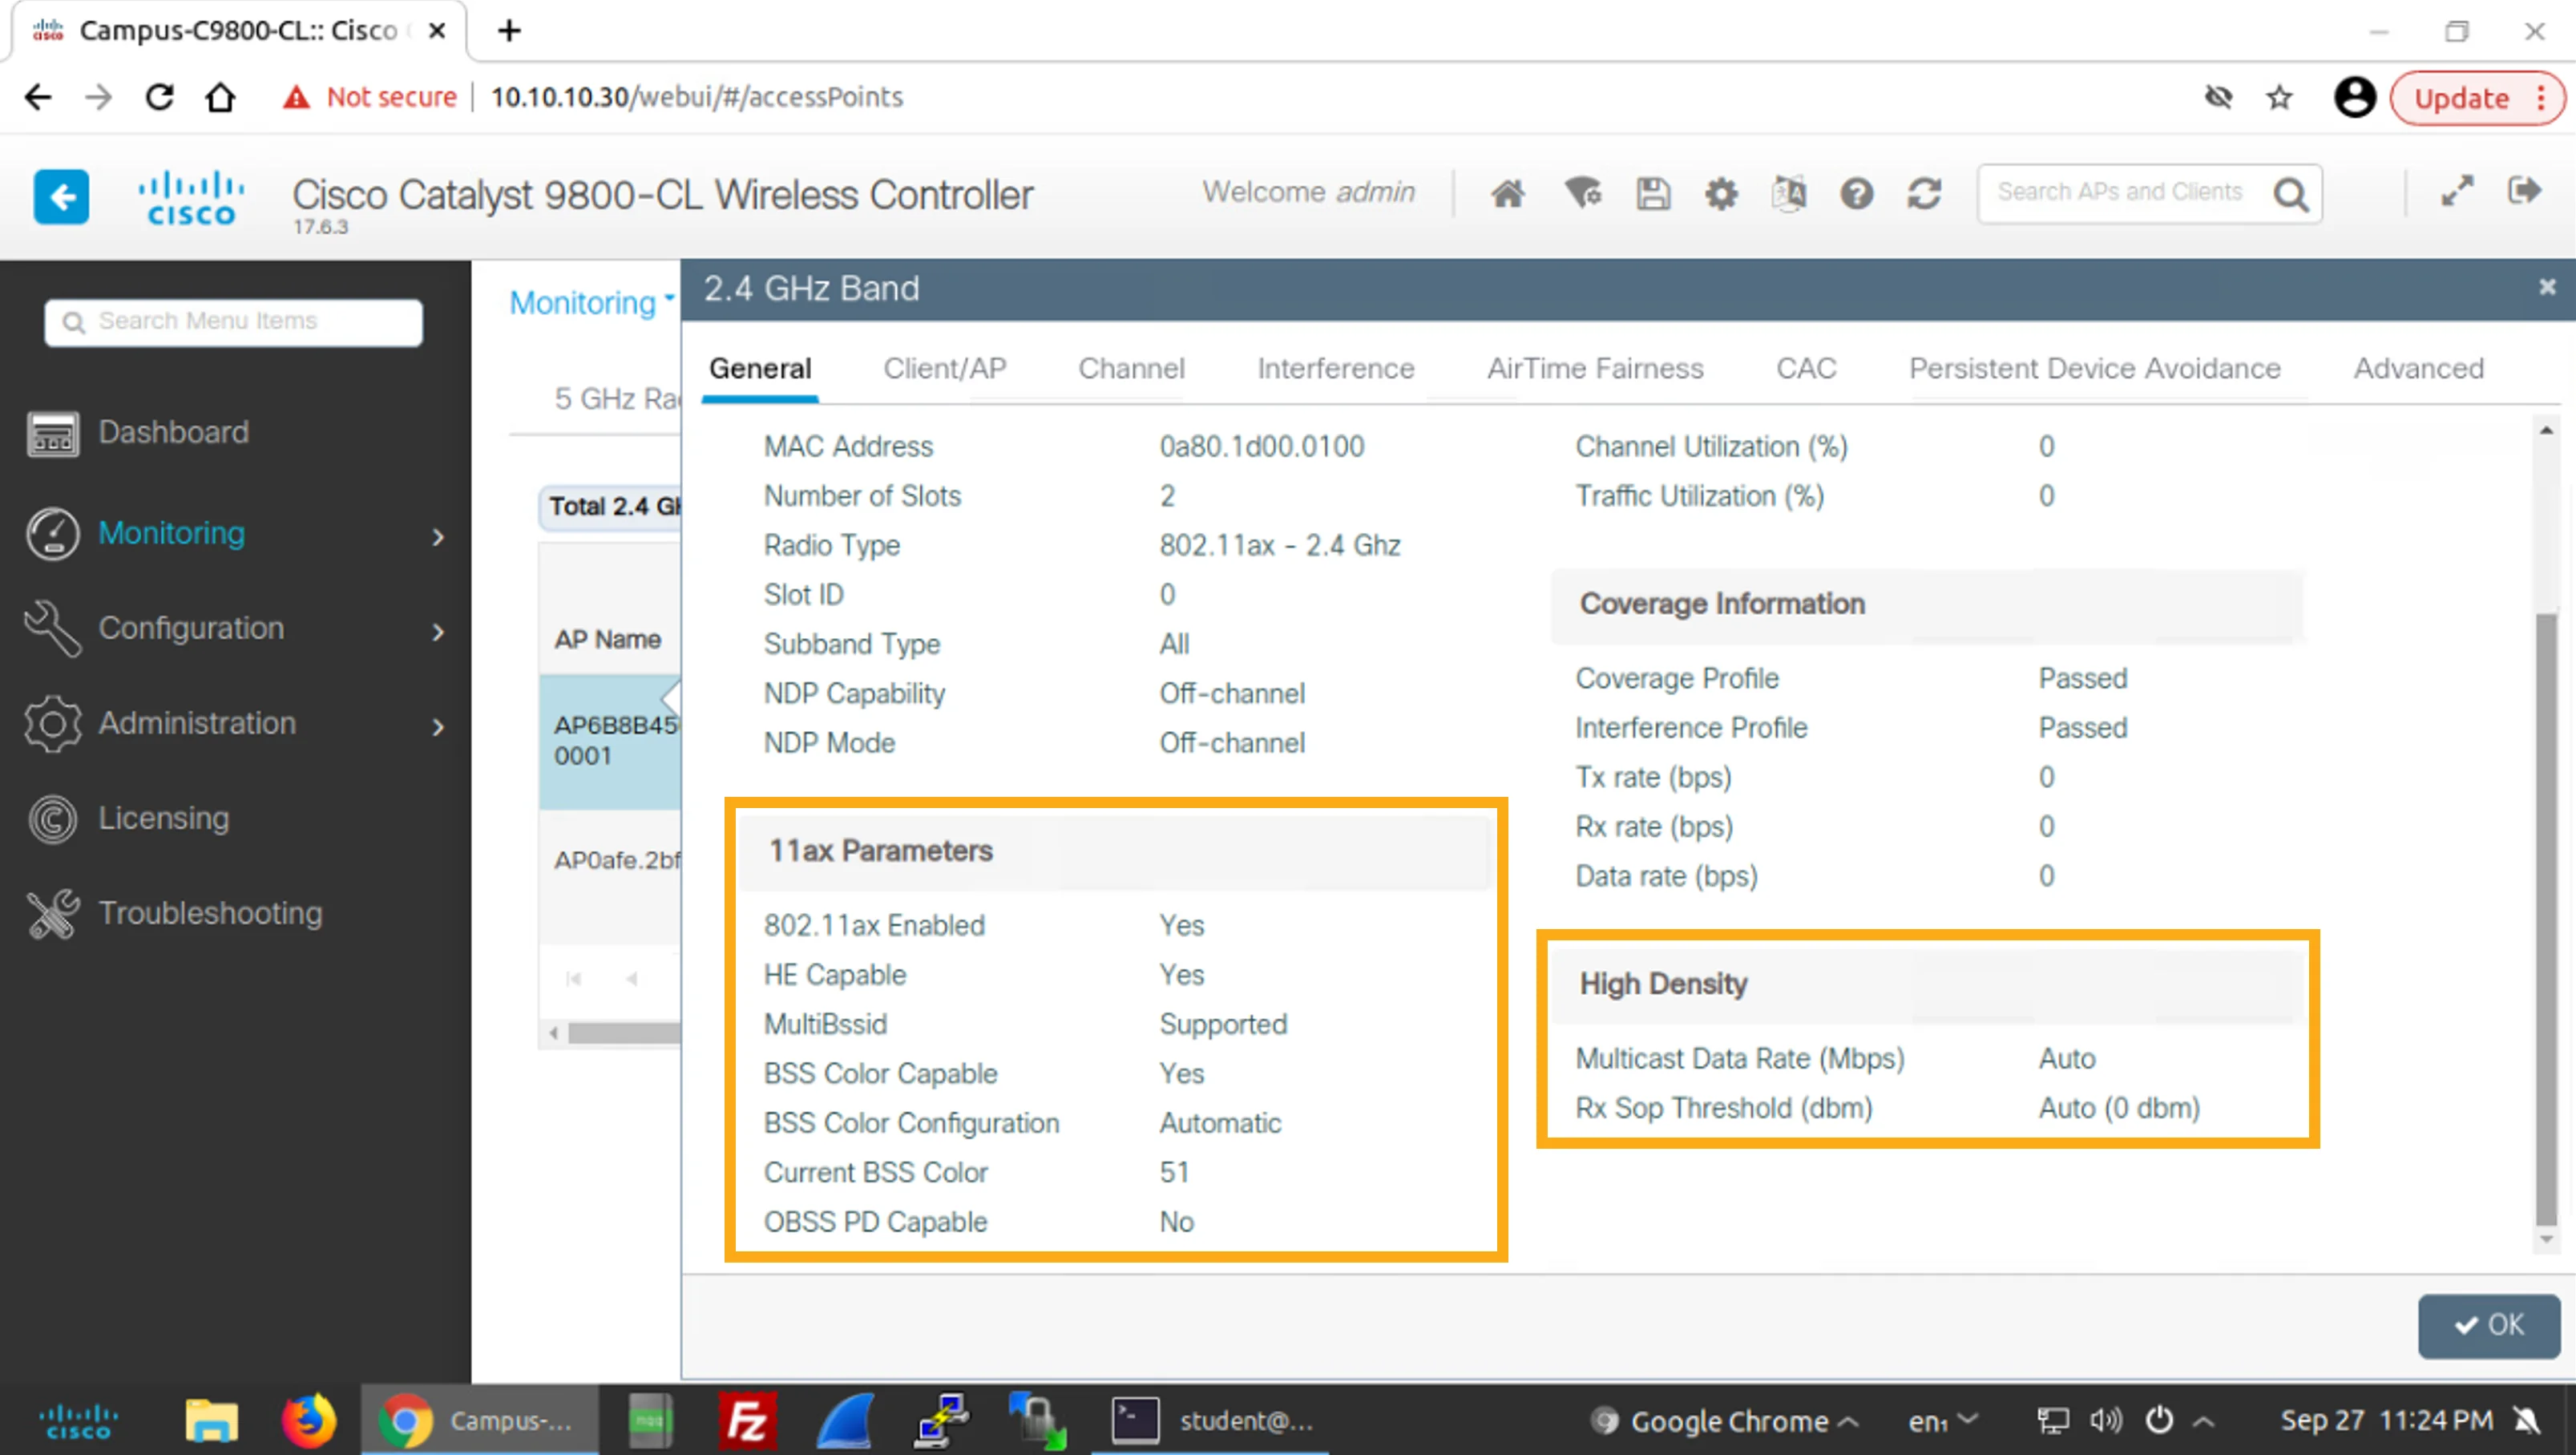
After you scroll down by clicking in the scroll bar area, you can see 11ax parameters and high-density information.
點按捲軸區域向下捲動後,你可以看到 11ax 參數與高密度資訊。
This information is provided in the upper part of the General tab.
以下資訊顯示於 General 標籤頁的上半部。
The following are the 11ax parameters and the high-density information.
以下為 11ax 參數與高密度資訊。
You have reached the last step of this simulation. Click Exit Lab Mode to end the simulation.
你已到達本模擬活動的最後一個步驟。點按結束實驗模式以結束模擬。